
Figures & data
Table 1. Demographic characteristics of the research participants, by sex (N = 260).
Table 2. Means, standard deviations, and correlations for the study variables (N = 260).
Table 3. Means and standard deviations by sex (participant, perpetrator, victim) (N = 260).
Table 4. Multiple regression models for offense severity, blaming perpetrator, and blaming victim (N = 241).
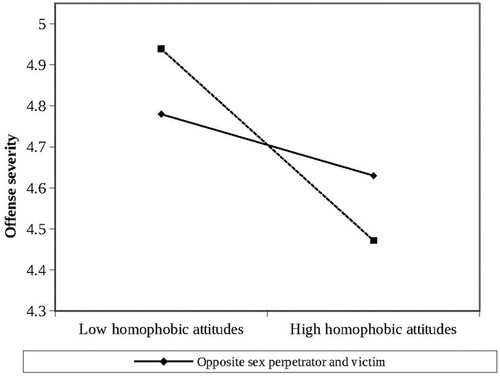
Figure 1. The moderating effect of same sex vs. opposite sex perpetrator and victim on the relationship between homophobic attitudes and offense severity.
Supplemental material