Figures & data
Table 1. Comparing Power Estimated in Three Statistics Texts Using the Pearson and Hartley Charts and SAS
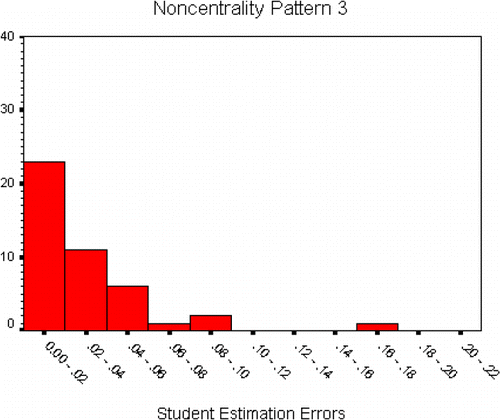
Figure 1. Histogram of Student Estimation Errors for Noncentrality Pattern 1.
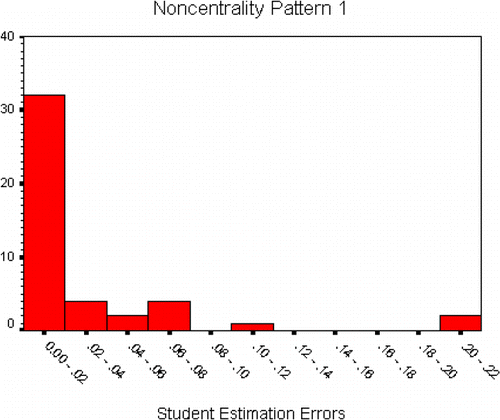
Figure 2. Histogram of Student Estimation Errors for Noncentrality Pattern 2.
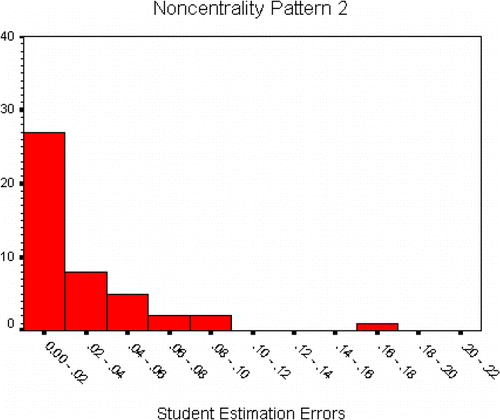
Figure 3. Histogram of Student Estimation Errors for Noncentrality Pattern 3.