Figures & data
Table 1. Textbook Prices in Dollars for Eight Faculties
Figure 1. Notched Boxplots of the Textbook Price Data. Note that Faculty g has a “notch” that is wider than the box, giving the strange appearance for this sub-sample.
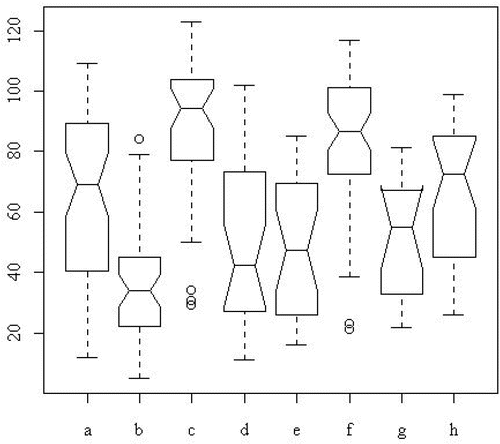
Figure 2. Notched Boxplots of the Absolute Deviations From Group Medians of the Textbook Price Data. Drawn with R, version 1.010. Once again, Faculty g has a box that does not cover the notches.
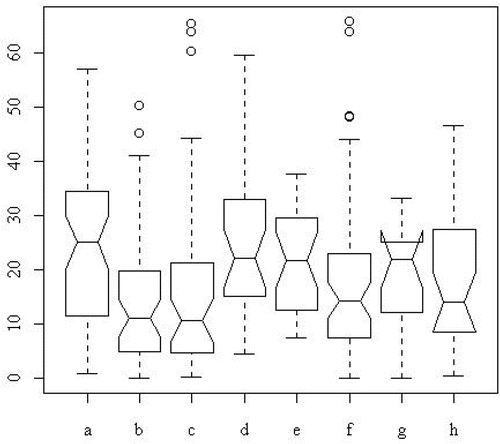
Figure 3. Boxplots of Square Roots of the Absolute Deviations From Group Medians of the Book Price Data.
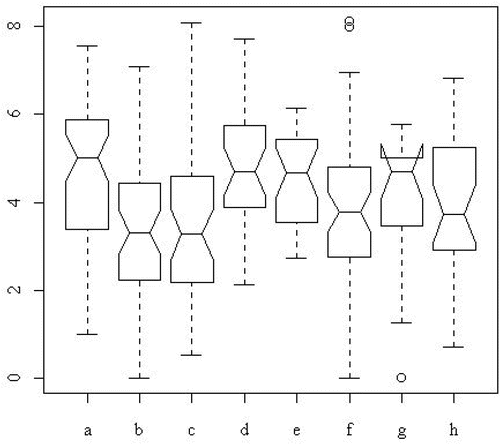
Figure 4. Boxplots of the Logarithm of the Absolute Deviations From Group Medians of the Book Price Data.
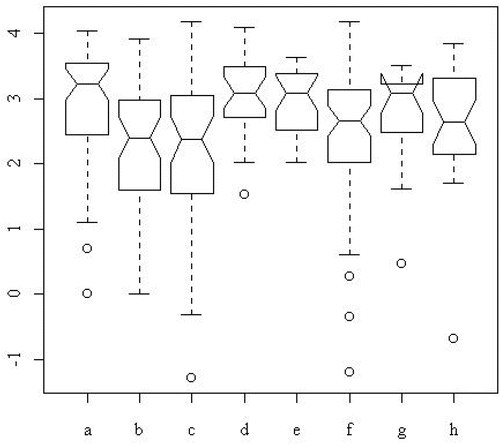
Figure 5. Spread Versus Level Graph of the Textbook Price Data Using Square Root Transformation of Deviations From Group Medians. Produced with Minitab SE 12, using the macro SPRLEVGR.MAC.
Table 2. Minitab Output for Levene Test for Textbook Price Data
Table 3. Minitab Output for Kruskal-Wallis Test on Absolute Deviations From Group Medians for Textbook Price Data