Figures & data
Table 1. Sample of the first 4 turns for a two-person game.
Table 2. Students' guesses for the best number of dice after playing once.
Table 3. Mean values for ten rolls using the same number of dice each time.
Table 4. Students' guesses for the best number of dice after finding mean scores.
Table 5. Equally likely scores, rolling one die.
Table 6. Equally likely scores, rolling two dice.
Table 7. Expected scores for rolling 1-12 fair six-sided dice.
Figure 1 Expected scores for rolling from 1 to 40 fair six-sided dice.
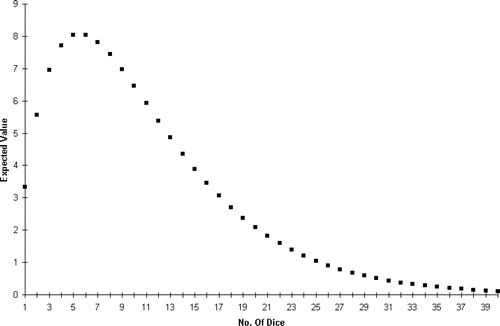
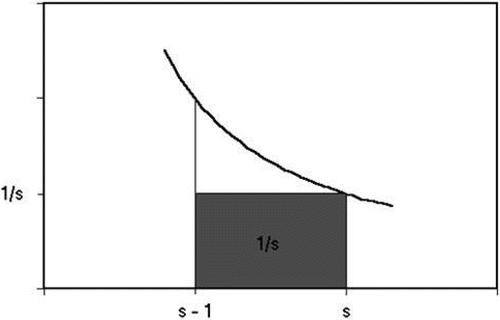
Figure 2 Graph of Y = 1 / X.