Figures & data
Table 1. Original and Revised Phase-Out Schedules for CFS in Developed Countries
Figure 1. Monthly Atmospheric Concentrations of CFCs (parts per trillion) from January 1977 to September 2004
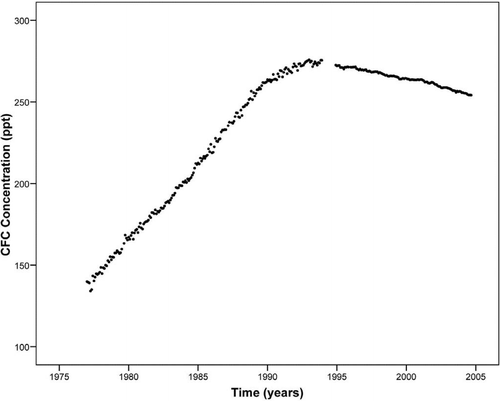
Figure 2. Worldwide Production of CFCs 1985–2004
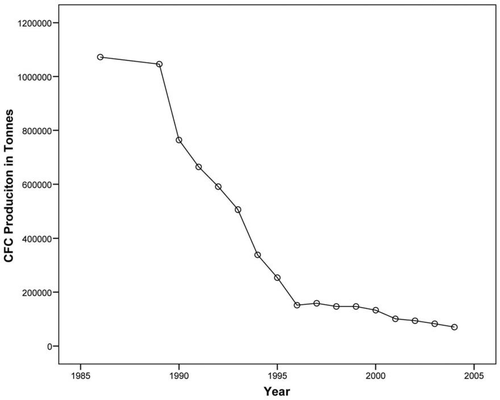
Table 2. ANOVA Table for the Simple Linear Regression Models
Table 3. Parameter Estimates for the Simple Linear Regression Models
Table 4. ANOVA Table for the Simultaneous Linear Regression Models
Table 5. Parameter Estimates for the Simultaneous Linear Regression Models
Figure 3. Comparing Predicted Levels of Atmospheric Concentrations of CFCs (parts per trillion) Using the Pre-Montreal Protocol and the Post Montreal Protocol Data
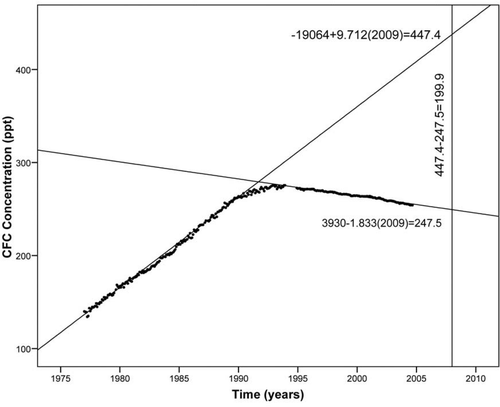
Figure 4. Residual Values for the Simple Linear Model fit to Pre-Montreal Protocol Data
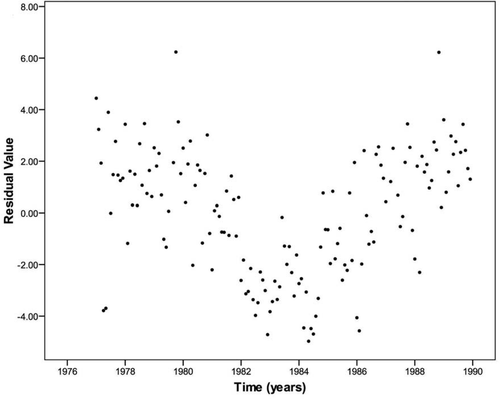
Figure 5. Residual Values for the Simple Linear Model fit to Post-Montreal Protocol Data
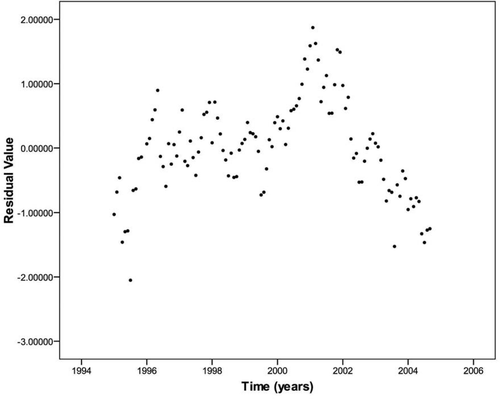
Table 6. ANOVA Table for the Simple Linear Regression Models
Table 7. Parameter Estimates for the Simple Linear Regression Models