Figures & data
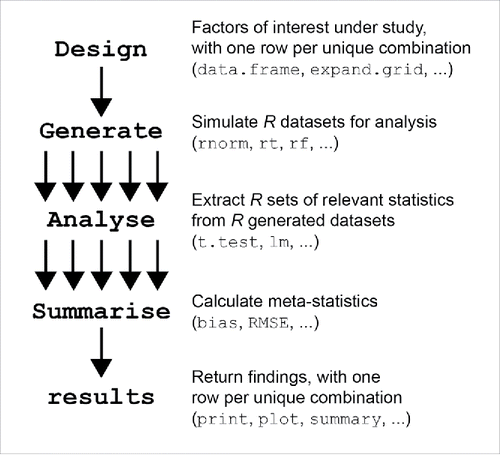
Figure 1. The underlying framework for simulation studies revolves around the following three primary areas: generating data, analyzing results, and then summarizing the findings.

Table 1. Simulation results on the effect of sample size and the standard error.
Table 2. Simulation results comparing EDRs from the standard t-test with those conducted with the Welch correction, manipulating the standard deviation and group size ratios. Bold-faced elements highlight error rates that are clearly discrepant from the nominal α = 0.05.
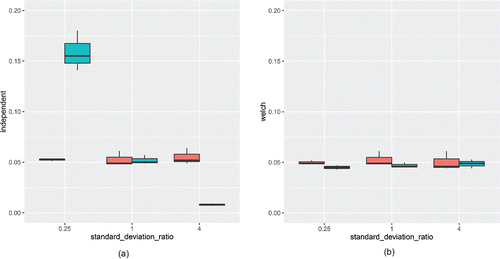
Figure 3. Type I error rate estimates for the independent sample -test, with (right) and without (left) the Welch correction. Red boxplots indicate that the group sizes were equal, while teal boxplots indicate that the second group had twice as many data points as the first group.

Table 3. Simulation results comparing confidence intervals when based upon the t- and Z-distributions.

