Figures & data
Table 1. The number of students taking each level of the LOCUS assessments during the pilot and operational administrations.
Table 2. Summaries of what graphs were used and from which student's data were collected.
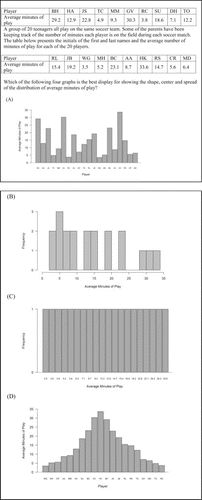
Figure 2. The full text of Item 2. This item assesses the collect data step at GAISE Level B and CCSSM 6.SP.4 and S-ID.1.
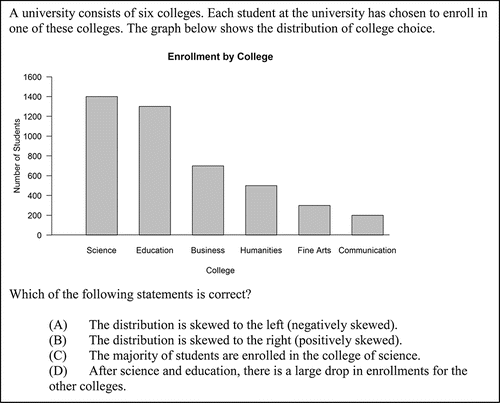
Figure 3. The full text of Item 3. This item assesses the analyze data step at GAISE Level B and CCSSM 6.SP.5c and S-ID.3.
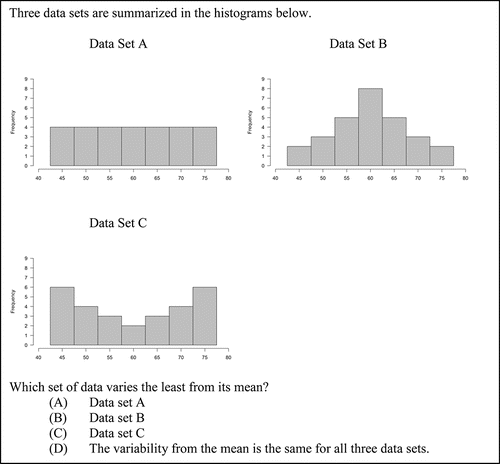
Figure 4. The full text of Item 4. This item assesses the analyze data step at GAISE Level B and CCSSM 6.SP.5c and S-ID.3.
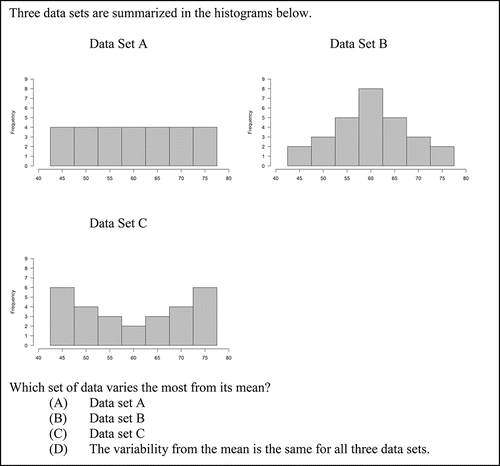
Figure 5. The full text of Item 5. This item assesses the analyze data step at GAISE Level B and CCSSM 6.SP.5c and S-ID.2.
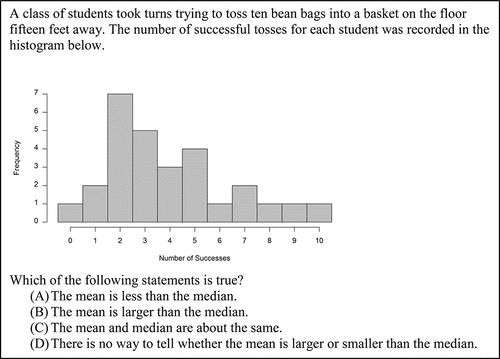
Figure 6. The full text of Item CR1. This item appeared on the Beginning/Intermediate version of the assessment and assesses CCSSM 1.MD.4, 3.MD.10, and S-ID.3.
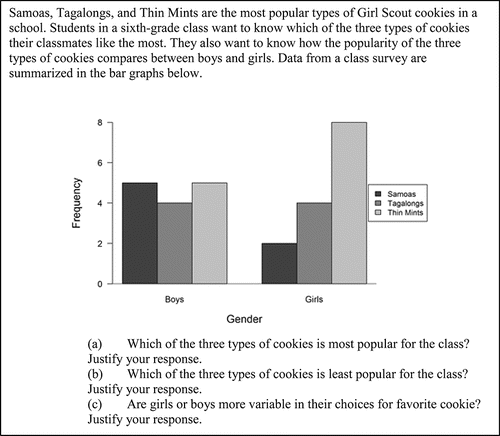
Figure 7. The full text of Item CR2. This item appeared on the Intermediate/Advanced version of the assessment and assesses CCSSM 7.SP.3, 7.SP.4, S-ID.2, S-ID.3, and S-IC.3.
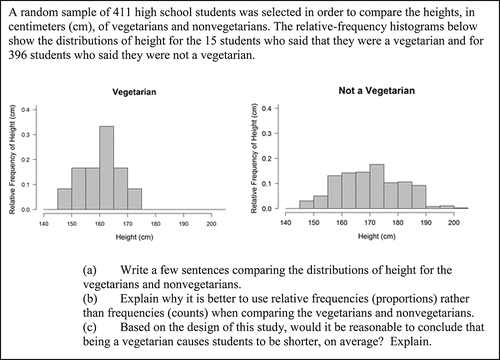
Table 3. For each item, the percentage of students that chose each response and the total number of students responding to the question.
Table 4. Percentage of students receiving each score for the constructed-response items.
Figure 8. Example correct student responses to part (c) of Item CR1.
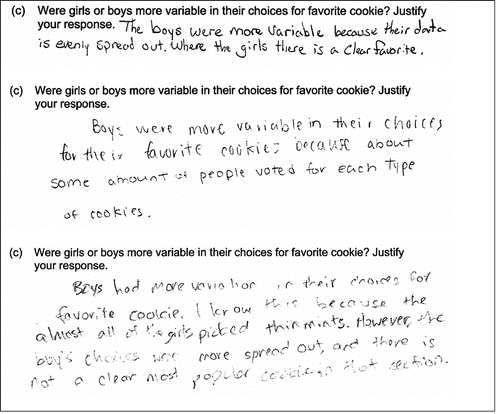
Figure 9. Example incorrect student responses to part (c) of Item CR1.
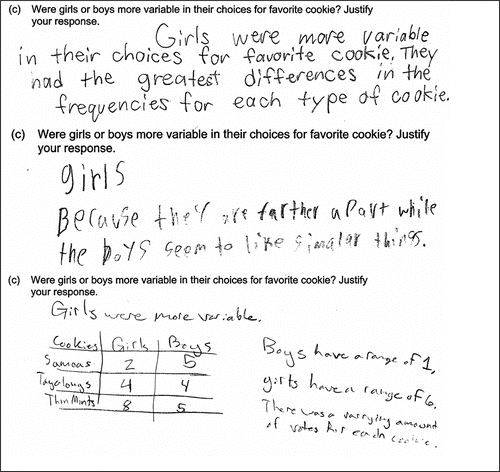
Figure 10. Example correct student responses to part (a) of Item CR2.
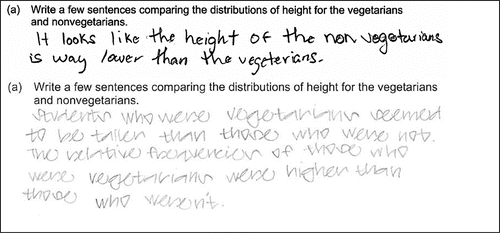
Figure 11. Example incorrect student responses to part (a) of Item CR2.