
Figures & data
Table 1 Description of variables.
Table 2 Summary statistics.
Table 3 Correlation matrix for the 17 quantitative variables of interest (lower triangle).
Table 4 Estimated coefficients for the logistic regression model: all predictors.
Table 5 Eigenvalue for the correlation matrix of the quantitative variables of interest.
Table 6 Results of backward selection procedure: z-statistic p-values with .
Table 7 Eigenvectors for the correlation matrix for the retained components.
Table 8 Correlation matrix for the 17 quantitative variables of interest and retained principal components.
Fig. 1 Scatterplots of the principal components scores versus their “interpretation”.
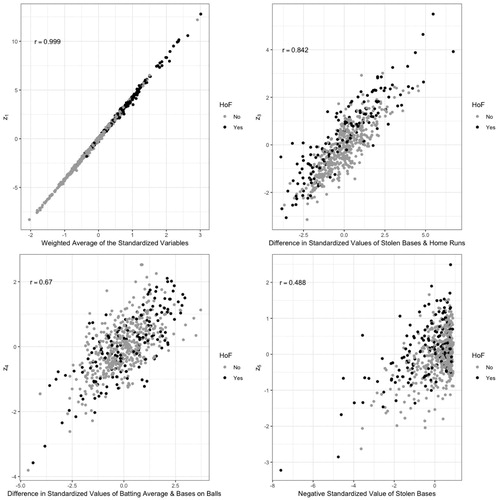
Table 9 Estimated coefficients for the logistic regression model.
Fig. 2 Deviance residual plots versus fitted values and retained principal components.
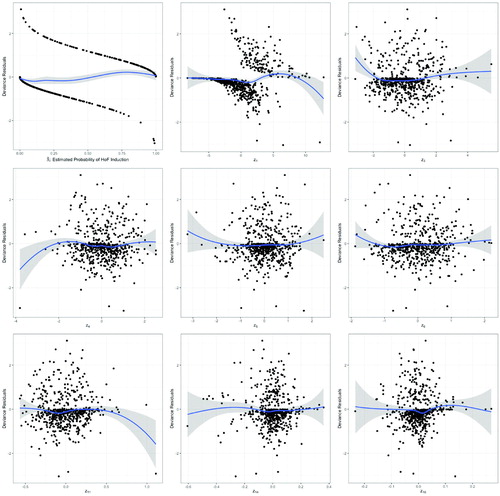
Table 10 Player classification: logistic regression model results.
Table 11 Player classification: predicted Hall of Famers not in the Hall of Fame.
Table 12 Player classification: Hall of Famers predicted not to be in the Hall of Fame.