Figures & data
Table 1 Background information about children participating in the research.
Fig. 1 Case value bars produced by Mary and Tyrone to represent game scores obtained after rolling a pair of dice 10 times. Mary’s graph indicated that she scored 4 on the first trial, 7 on the second and third, 6 on the forth, etc. Similarly, Tyrone’s graph shows scoring 9 on the first trial, 6 on each of the next three trials, etc.
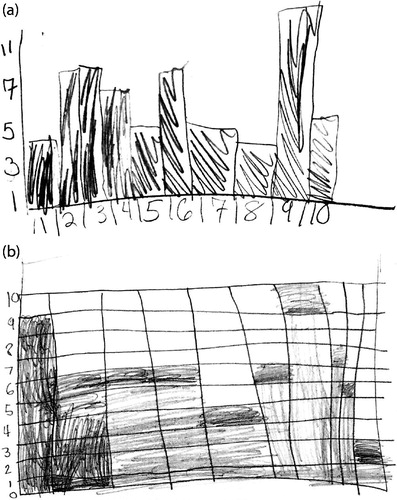
Fig. 2 Brian’s post-interview graphical representation for an item about puppy weights.
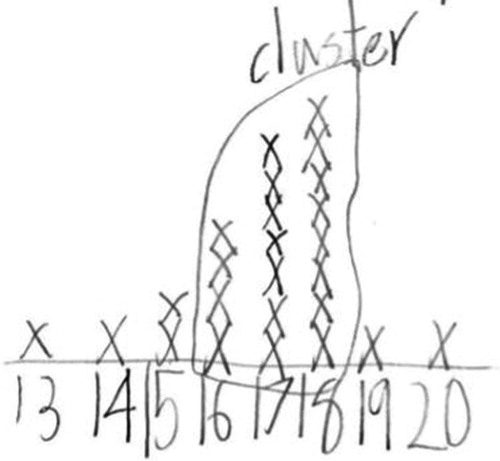
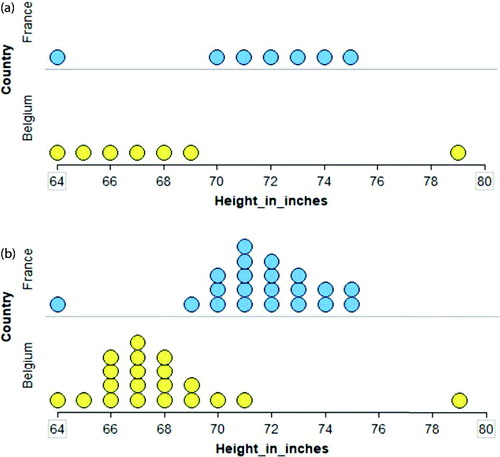
Fig. 3 (a) Datasets (heights of individuals on two soccer teams) intentionally constructed not to have multiple-size stacks to draw students’ attention to features other than the mode; (b) dataset used to reintroduce multiple-size stacks.