Figures & data
Fig. 1 The m&m’s® color distributions produced at the New Jersey and Tenessee factories, respectively. The percentage of blue, orange, and green m&m’s® differ the most between the two factories. This chart originally appears in Purtill (Citation2017), and was created by Purtill (Citation2017), using data from Wicklin (Citation2017).
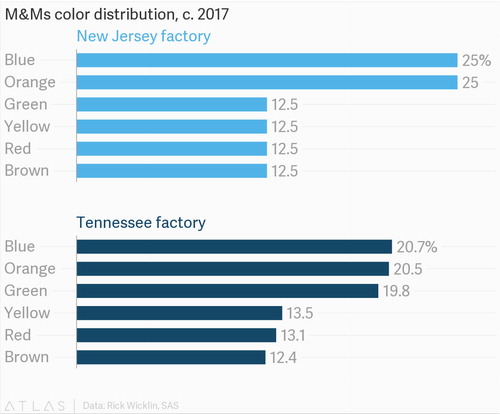
Fig. 2 The prior distribution for the probability of drawing a blue m&m’s® from a bag of m&m’s®, as determined by the class of undergraduates (solid curve) and by the seminar of graduate students, postdocs, and faculty (dashed curve). In general, students believed it was less likely to draw a blue m&m’s® than did the seminar members.
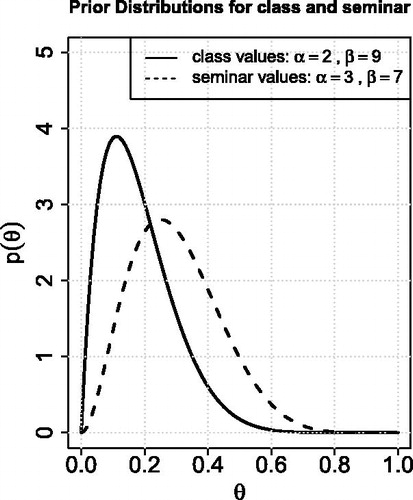
Fig. 3 Posterior distributions for instructor’s data (dashed curve), and for the combined data from the entire class (solid curve). The prior distribution (dotted curve) and posterior mean for the class’ posterior distribution (red vertical dashed-dotted line) are also shown for reference. The m&m’s® used were produced in the Hackettstown, New Jersey factory (HKP).
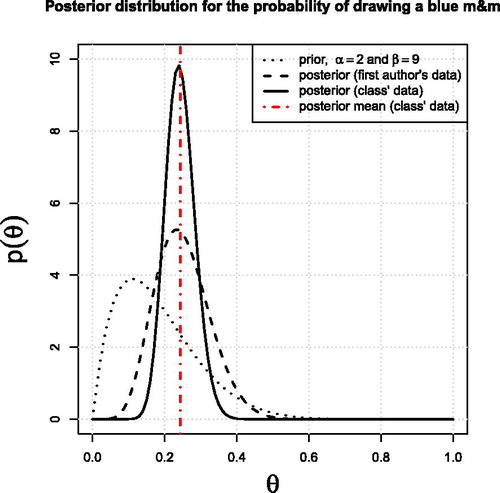
Fig. 4 A picture of the lot number from a package in the third-year undergraduate class. The code HKP indicates the package came from the Hackettstown, New Jersey factory.
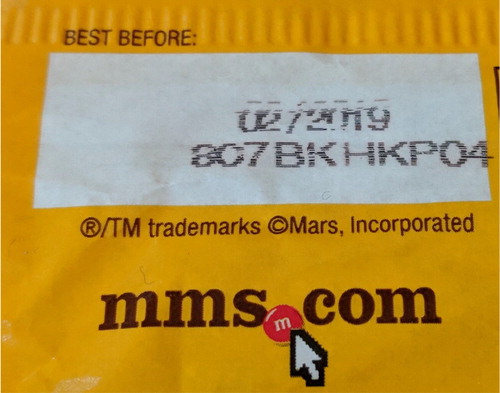
Fig. 5 Posterior distributions for the DIRAC Institute seminar and the first author’s bag of m&m’s®. The m&m’s® used for this seminar were produced in the Cleveland, Tennessee factory (code CLV), and the data used to generate this figure are included as supplemental material.
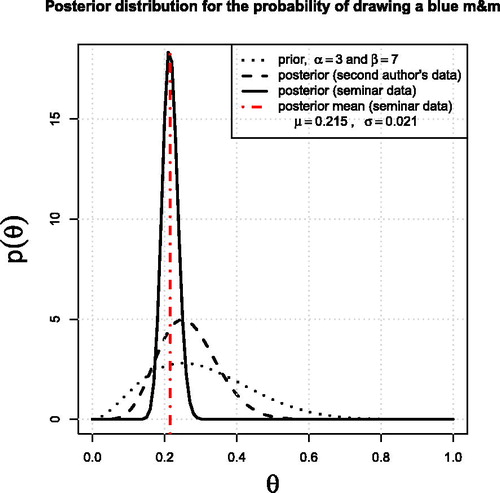
Fig. 6 A picture of the lot number from a package from the seminar. The code CLV indicates the package came from the Cleveland, Tennessee factory.
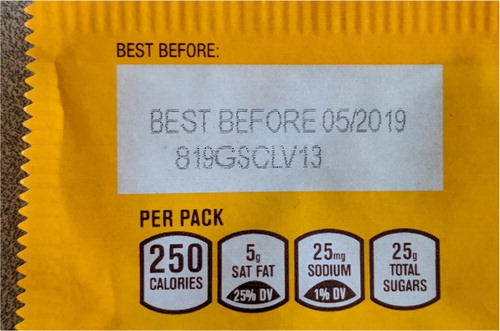
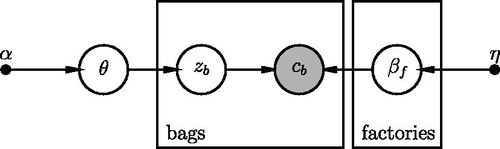
Fig. A.1 A probabilistic graphical model describing the hierarchical approach to modeling b bags of m&m’s® from different factories . The vector cb denotes the number of m&m’s® of each of the six colors in a single bag b. zb are the latent assignments of each bag to a factory, θ indicates the mixture proportions for the two factories, and βf are the colour distributions for each factory. Finally, α and η denote the hyperparameters for the Dirichlet priors on θ and βf. Figure generated using DAFT, https://daft-pgm.org/.