Figures & data
Fig. 1 Initial screen of simulator.
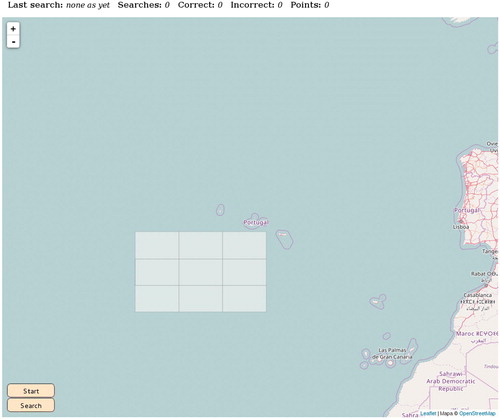
Fig. 2 Simulator screen after one correct but unsuccessful search.
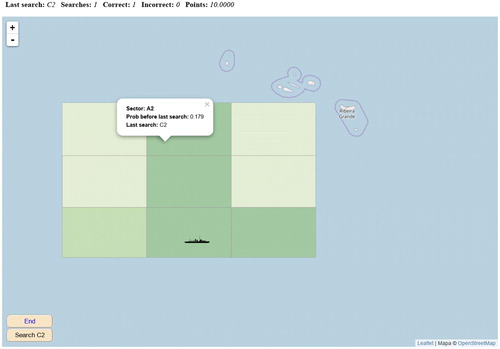
Fig. 3 Breakdown on grades in pre- and post-test according to use of simulator.
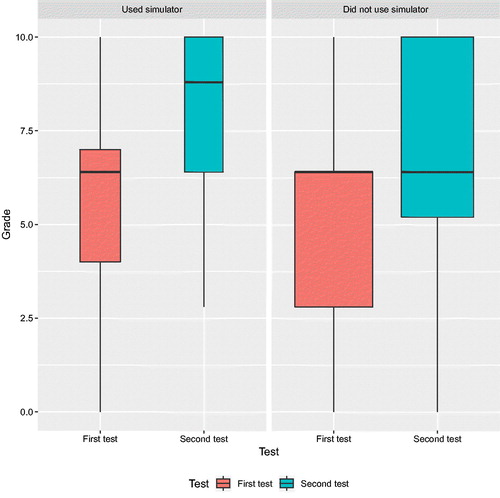
Fig. 4 Individual performances in pre- and post-test according to use of simulator and score obtained. Each point is color-coded reflecting the score obtained when using the simulator (right legend), with students who did not use it shown in gray.
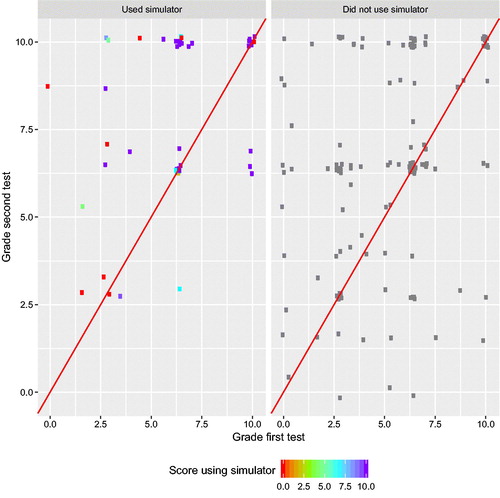
Fig. 5 Breakdown of grades in pre- and post-test according to use of simulator per group. Each point is color-coded reflecting the score obtained when using the simulator (right legend), with students who did not use it shown in gray.
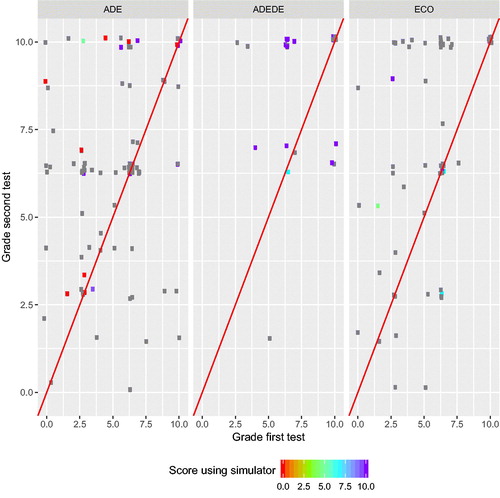
Table 1 Effect on Grade of use of simulator.
Table 2 Comparison of models.
Fig. 6 Breakdown of grades in pre- and post-test according to perceived usefulness of the simulator. Students responded that it helped
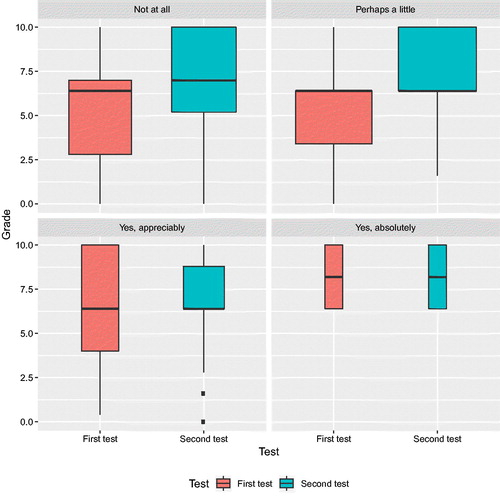
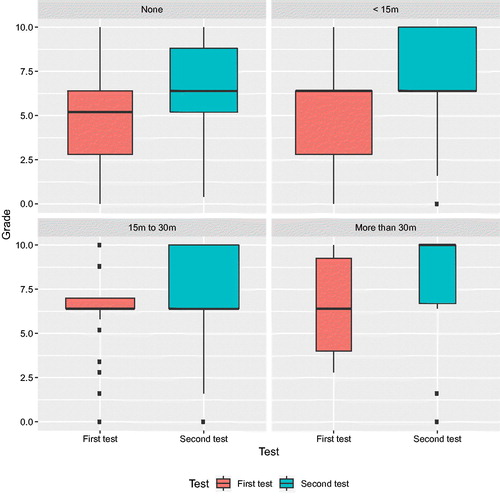
Fig. 7 Breakdown of grades in pre- and post-test according to time spent using the simulator.