Figures & data
Fig. 1 Smoking, low birthweight, and infant mortality. The link between nodes indicates association instead of causation.
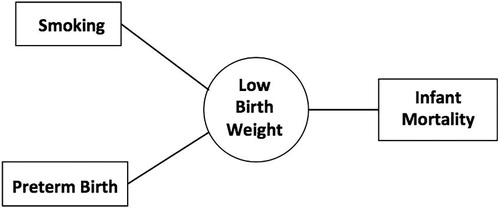
Fig. 2 Items recommended when a camera is clicked. Courtesy walmart.com.

Fig. 3 The data science life cycle.
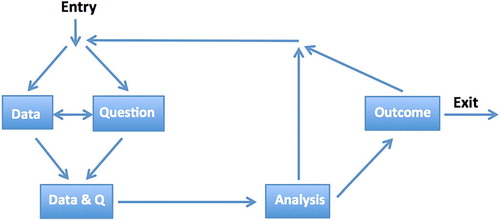
Fig. 4 Alternative diagrams related to the analysis of data. (a) The data science process diagram of Schutt and O’Neil; (b) the data science workflow of Guo; (c) the PPDAC cycle; (d) the Wickham–Grolemund data science cycle.
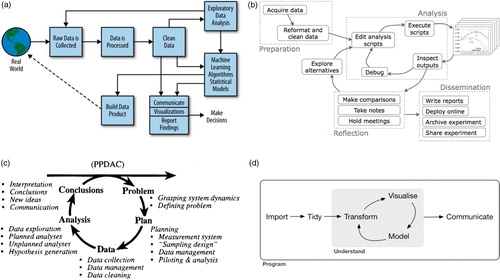
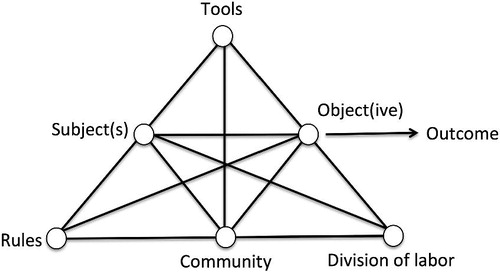
Fig. 5 A generic activity triangle.