
Figures & data
Fig. 1 Timeplot of winning time of Kentucky Derby (through 2018).
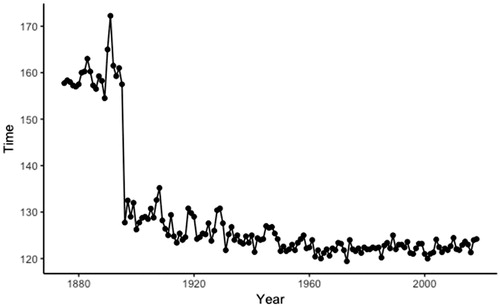
Fig. 2 Graph of speed versus year with LOESS smoother and residual plots from linear model.
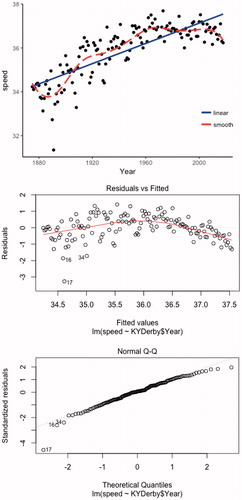
Fig. 3 Graph of speed versus year and quadratic models of speed versus year and versus year – mean(year).
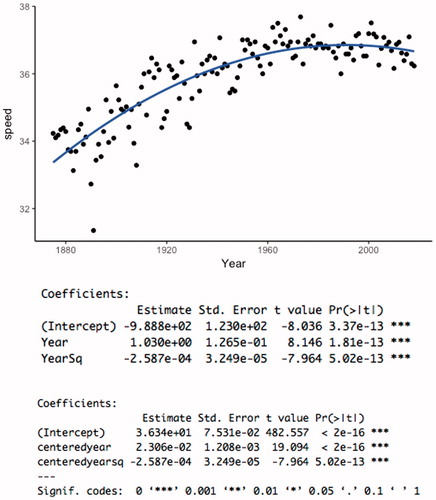
Fig. 4 Linear, quadratic, and shifted log transformation of speed versus year - 1874.
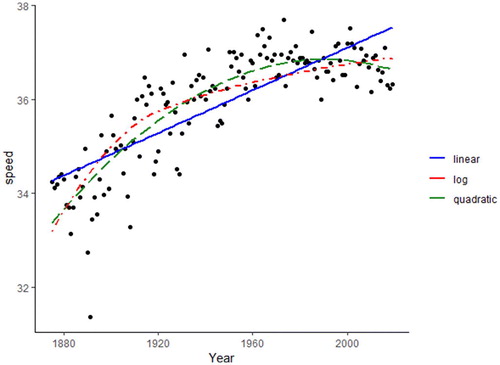
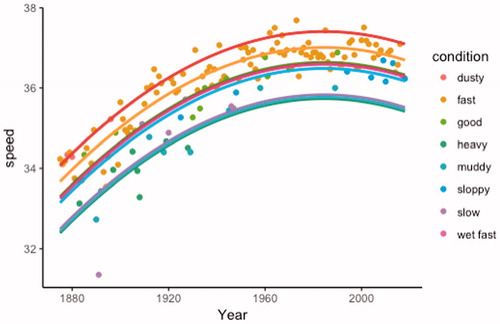
Fig. 5 Quadratic model with separate fits for each track condition.
Supplemental material