Figures & data
Table 1 Table of variables in the diving dataset.
Table 2 Table of summary data for the diving dataset.
Fig. 1 Visual representations of the final meet score.
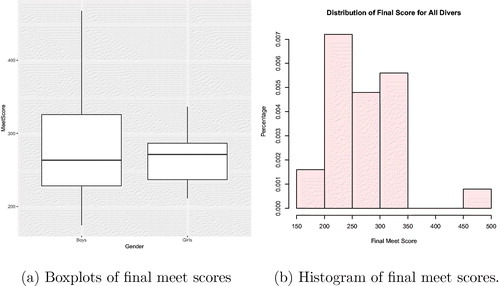
Fig. 2 Boxplots of judges’ scores by judge and gender of diver.
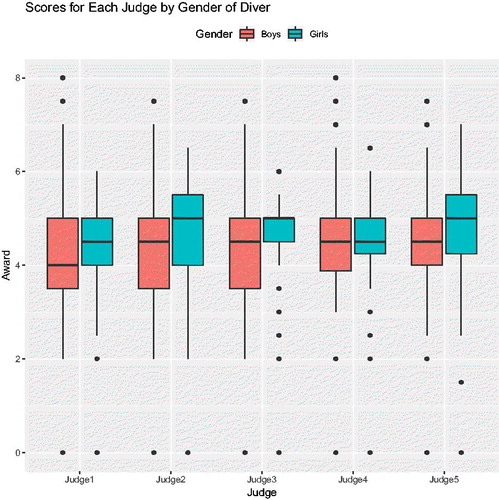
Fig. 3 Trajectories of round scores for each diver. Lines represent scores across rounds for each diver.
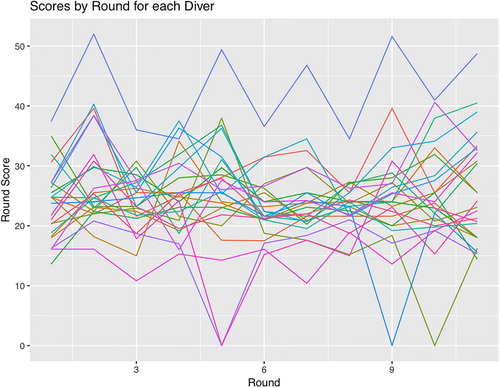
Fig. 4 Trajectories of round scores for each diver by gender. Lines represent scores across rounds for each diver.
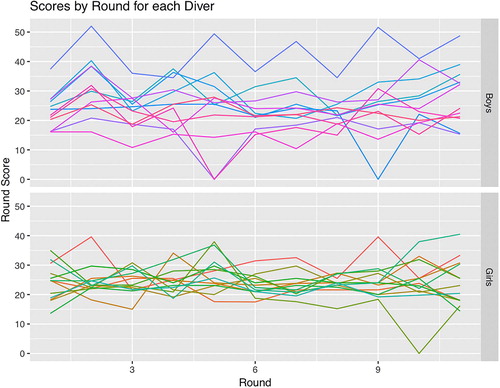
Fig. 5 Average of middle three judges’ scores for each dive by place of the diver. Girls scores are on the left, boys on the right. Each dot represents a different judge’s score for a particular dive. Low DD dives () are colored blue while high DD dives are colored gold.
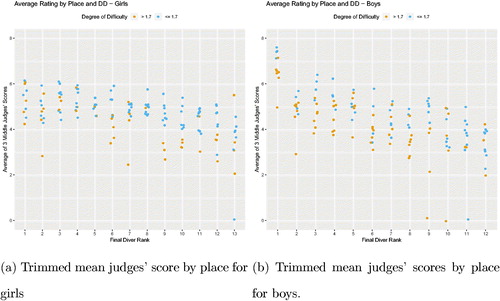
Fig. 6 Official meet scores (with round off error) on the left versus calculated scores (no round off error) on the right for male and female divers. The lines connect scores corresponding to the same diver.
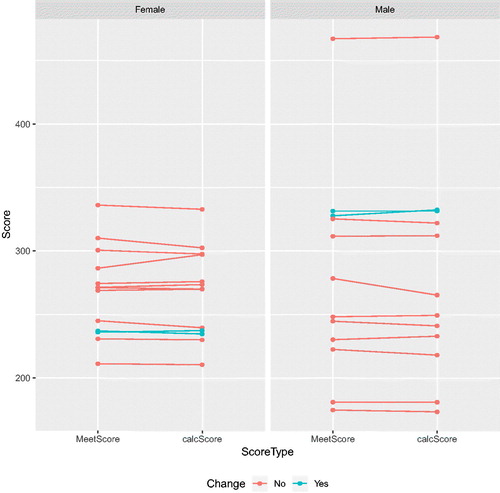
Table 3 Pearson and Spearman correlations for average DD and median DD versus 20% trimmed mean judges’ scores.
Fig. 7 Average DD (top row), median DD (middle row), and final score (bottom row) for each diver. Boys’ scores are labeled with cyan squares and girls’ scores are labeled with coral circles.
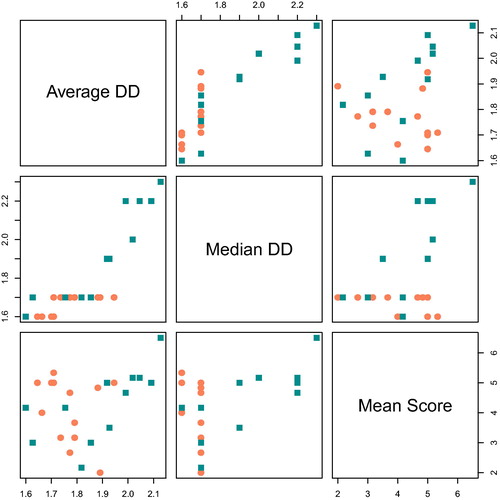
Table 4 Example method of assigning categories for computation of Cohen’s kappa.
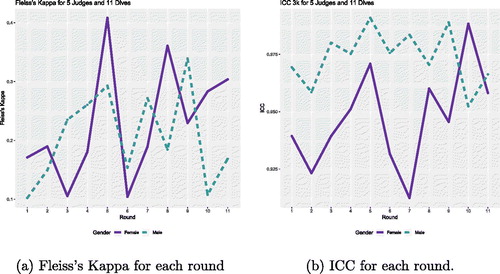
Fig. 8 Measures of agreement for each round. Agreement for girls is represented by the solid purple line and agreement for boys is represented by the green dashed line in both figures.