
Figures & data
Table 1 Possible matches grouped by years of experience.
Fig. 1 Histograms of self-reported teaching practices for possible participants by subscale.
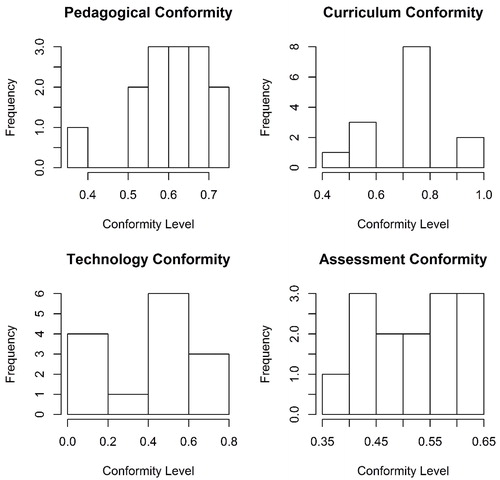
Fig. 2 Scatterplot of possible participants’ beliefs and practices subscales from the STI.
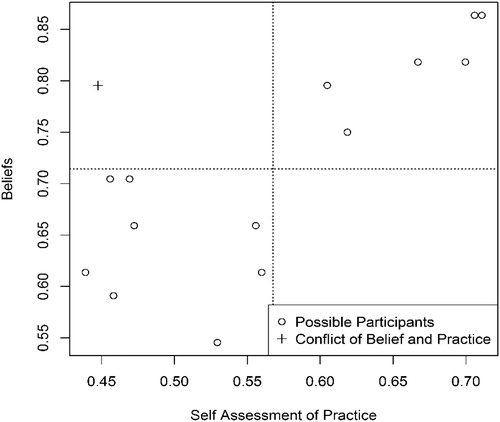
Fig. 3 Histogram of average across all SRLE constructs contained in survey.
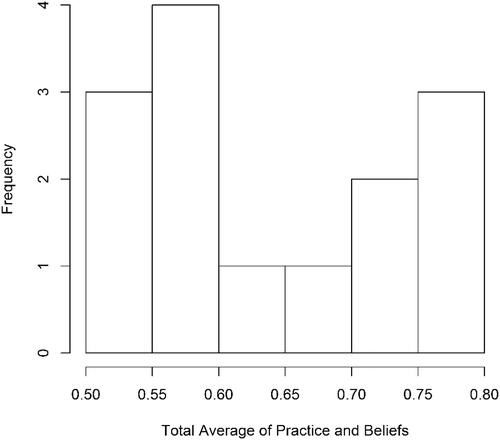
Table 2 Comparison of matched teachers at all levels.
Table 3 Student response rates.
Table 4 Teacher sample sizes of pretests, posttests, and matched tests.
Table 5 ANCOVA test for differences between conformity levels after controlling for pretests.
Table 6 ANCOVA test for differences between teachers after controlling for pretests.
Table 7 Adjusted class mean comparisons between matched teachers.
Fig. 4 Adjusted class mean visual comparison with national average.
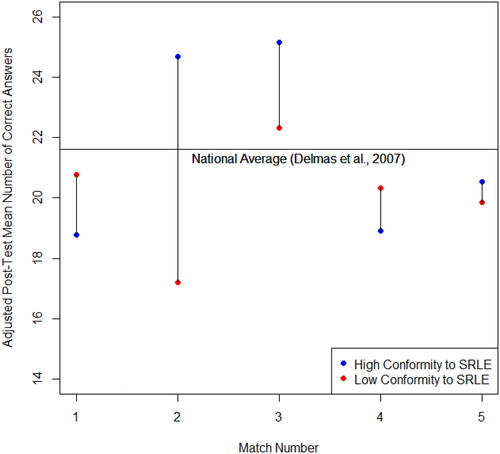
Table 8 Comparison of percent of increase between matched teachers.