Figures & data
Fig. 1 Low-tech tactile learning aids. (A) LEGO histogram of symmetrical distribution where mean = median = mode. (B) LEGO histogram of positively skewed distribution where mean is pulled toward outliers. (C) LEGO histogram of negatively skewed distribution. (D) Wooden blocks glued to a ruler balanced on a binder clip to demonstrate the mean as a balance point. (E) Another example where the student had to compare the block location of the mean to that of the median and mode. (F) Battleship pieces used to create a scatterplot with strong positive correlation. (G) Battleship pieces used to create a scatterplot with weak negative correlation. (h) Battleship pieces used to create an outlier on a scatterplot.
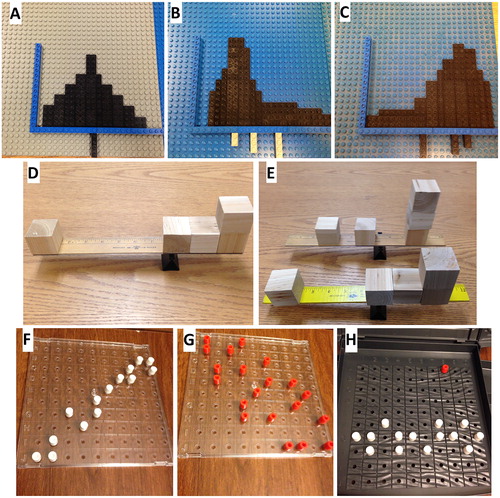
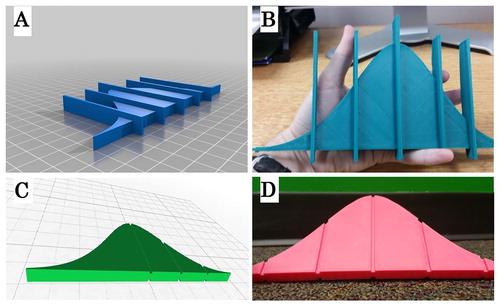
Fig. 2 Iterations of 3D printing designs for the normal curve used in our introductory statistics course. (A) Early three-dimensional model using raised lines to indicate the mean and one and two standard deviations from the mean. (B) Printing of that early model. (C) Improved three-dimensional model using channels cut into the curve, based on feedback from blind student; this version indicates the mean as well as one and two standard deviations on a single side only. (D) Printing of the improved model; this version indicates one and two standard deviations on both sides of the mean.