
Figures & data
Fig. 1 A causal diagram depicting treatment A causing Y with no common causes.

Fig. 2 A causal diagram depicting treatment A, outcome Y, and confounding variable C.
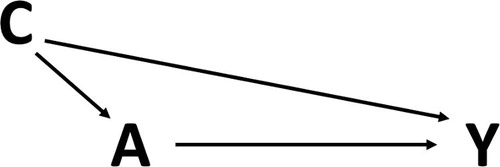
Fig. 3 A causal diagram depicting treatment A, outcome Y, collider Z, and no causal effect of A on Y.
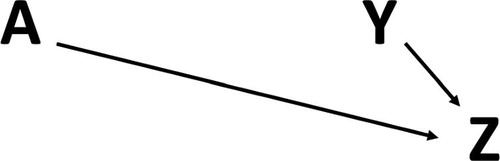
Fig. 4 A causal diagram depicting conditioning upon the confounder C.
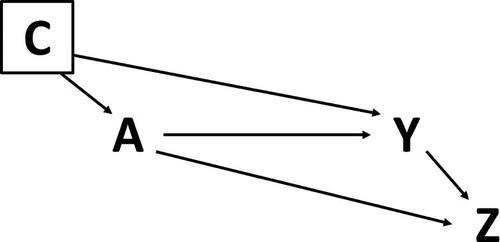
Fig. 5 A causal diagram depicting treatment A, outcome Y, a confounder C we have adjusted for, and unmeasured confounders U. In this case, we cannot obtain valid estimates of the causal effect of A on Y.
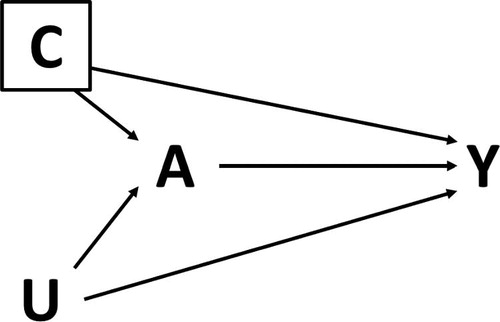
Table 1 Description of variables in this study.
Fig. 6 A causal diagram depicting relationships between variables in this study.
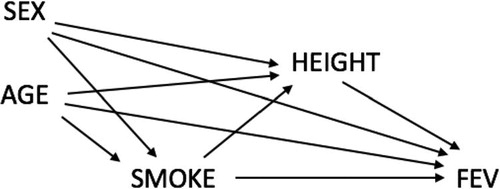
Table 2 Mean (standard deviation) by smoking status and sex.
Table 3 Estimates of the change in FEV (liters) comparing smokers to nonsmokers for two models.