
Figures & data
Table 1 Summary table showing the results from the hypothetical university survey.
Fig. 1 Screenshot from the Should It Pass? ShinyApp that allows students to modify the hypothetical survey design by adjusting the sample sizes of each strata. Students can also modify the proportion in each group that support the resolution. Graphs display the unweighted sample data and the weighted population estimates allowing students to compare the unweighted results and weighted estimates for the specified situation. This app as well as corresponding datasets and student lab handout are freely available at https://stat2labs.sites.grinnell.edu/weights.html.
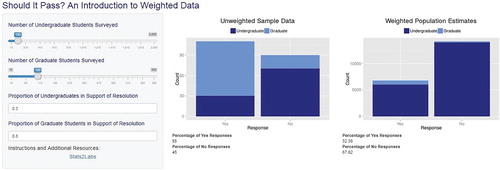
Table 2 First six rows of the university survey data demonstrating the use of weights.
Fig. 2 Screenshot from the interactive Political Preferences Citation1 ShinyApp which demonstrates that results weighted by race have much higher estimated Republican responses than the unweighted sample data. The variable displayed on the x-axis and the subgrouping variable can be changed to explore the dataset. The results can be shown in counts, as selected in the screenshot, or in percentages. This app as well as corresponding datasets and student lab handout are freely available at https://stat2labs.sites.grinnell.edu/weights.html.
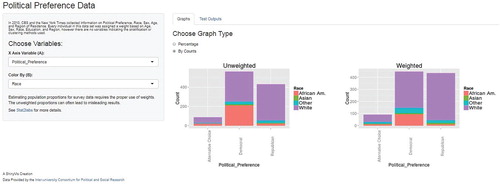
Table 3 The percentage of students who were able to properly complete the activities in the pre- and post-quiz related to weighted data.