
Figures & data
Fig. 1 Screenshot of the “One Variable with Sampling” applet from the Rossman/Chance collection.
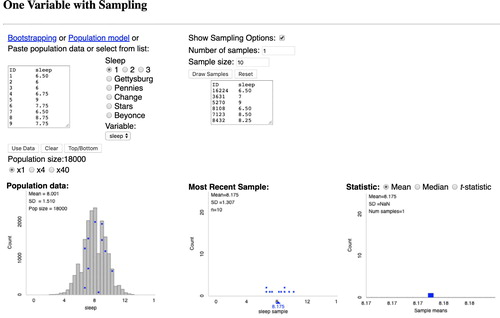
Fig. 2 Statistical inference pipeline using infer. This diagram expresses the “there is only one test” philosophy in code.
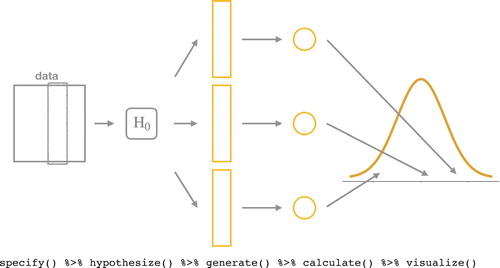
Fig. 3 Visualizing the p-value using infer and a permutation-based method. The area of the shaded histogram bars represents the p-value, while the solid red line indicates the value of the observed test statistic.
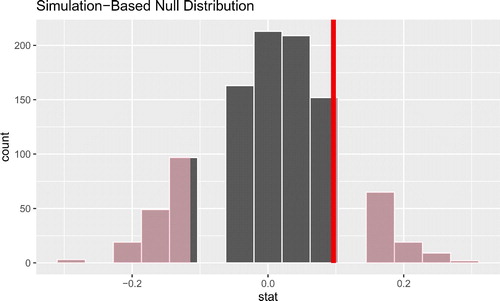
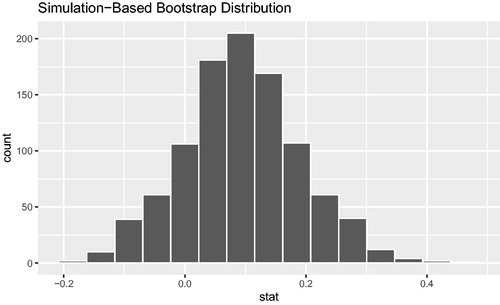
Fig. 4 Visualizing the bootstrap distribution for the difference in proportions using infer.
Supplemental material