
Figures & data
Fig. 1 Number of students majoring in STEM and non-STEM fields (left) and student genders (right) for each class section.
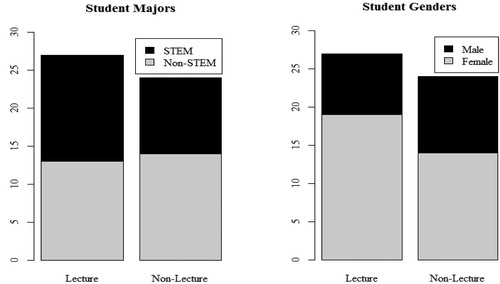
Table 1 Academic rank by section.
Table 2 SATS-36 attitude component descriptions.
Fig. 2 Boxplots of student pretest subscale scores by section and attitude component.
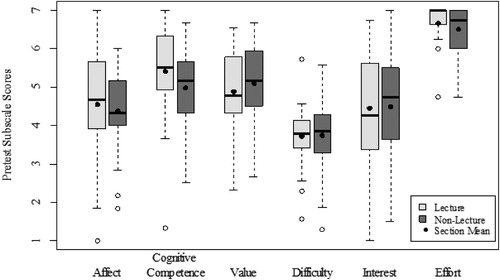
Table 3 Interquartile ranges for pretest and posttest subscale scores.
Table 4 Results from Mann–Whitney tests comparing the two course sections.
Fig. 3 Boxplots of student posttest subscale scores by section and attitude component.
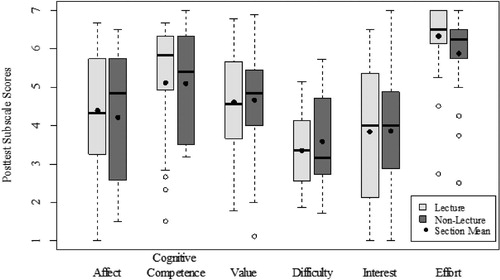
Fig. 4 Boxplots of student change in subscale scores (posttest–pretest) by section and attitude component. The reference line at 0 indicates no change in attitude.
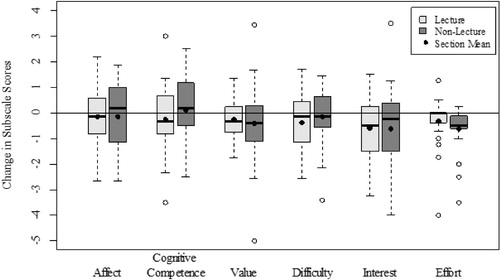
Table 5 Nonparametric inference results for change in attitude.
Table 6 Correlations (Spearman’s rho) between change in attitude and grades.