Figures & data
Fig. 1 Data science workflow diagram (Wickham and Grolemund 2017).
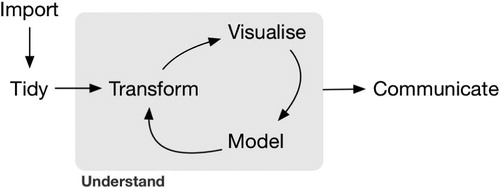
Fig. 2 The 80–20 rule of data wrangling.
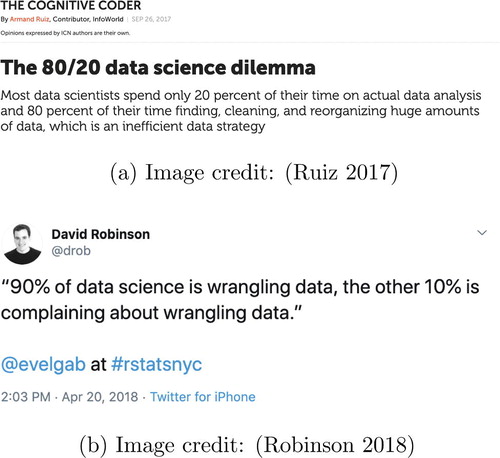
Fig. 3 “Playing the whole game”: data collection as well as data analysis in data science.
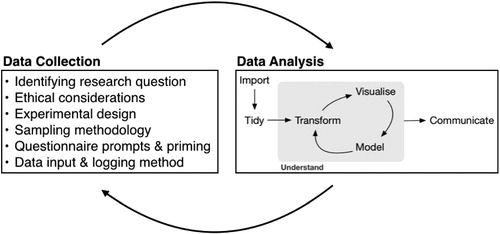
Fig. 4 Graphical representation of playing the “playing the whole game” with Google Calendar.
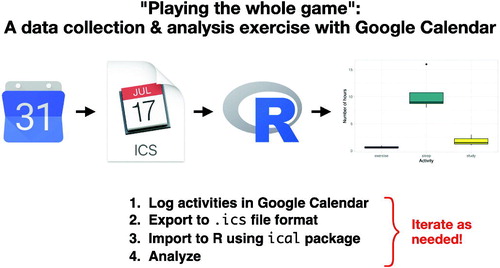
Fig. 5 Poll: Do you keep a calendar/schedule/planner?
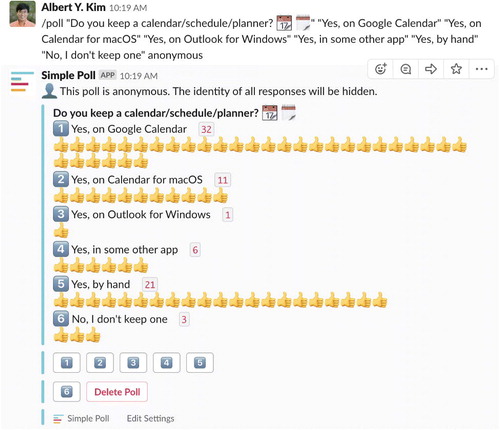
Fig. 6 Sample Google Calendar presented to students.
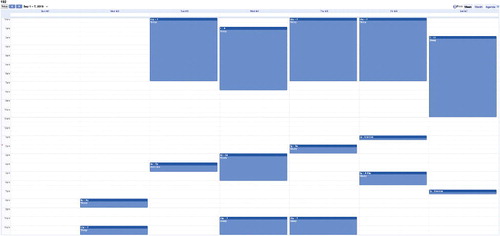
Fig. 7 Time series plot of calendar data.
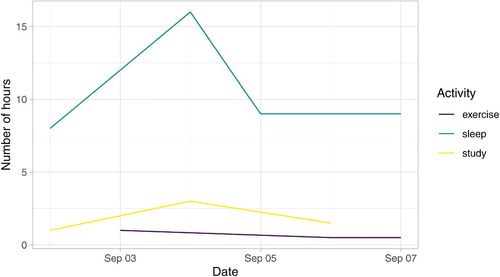
Fig. 8 Distribution of number of hours spent split by activity type.
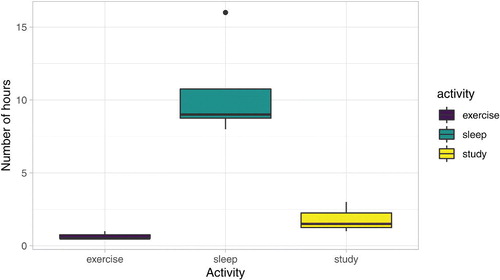
Table 1 Example calendar data frame.