Figures & data
Table 1 Expected number of flips until observing a given triplet.
Fig. 1 Monte Carlo simulation in Excel. The cells with borders (e.g., G11) identify cells whose code is explained in the article.
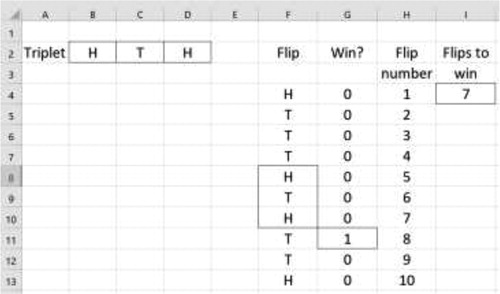
Fig. 2 Number of flips into the triplet at failure. A triplet can fail at the first, second, or third flip in a sequence of three flips. At the time of failure, the triplet will require, at a minimum, one to three more flips before being observed.
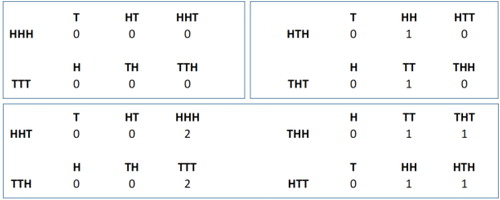
Table 2 Superior triplets (table).
Fig. 3 Superior triplets (graph). If Player A selects a grayed triplet, any triplet connected by an arrow has greater than one-half probability of appearing before Player A’s triplet.
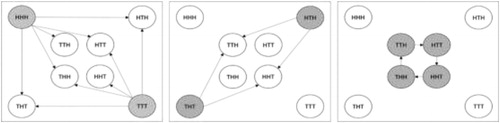
Fig. 4 Monte Carlo simulation in Excel-modified. The cells with borders (e.g., I4) identify cells whose code is explained in the article.
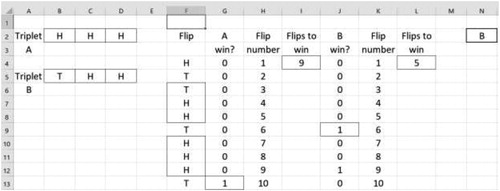
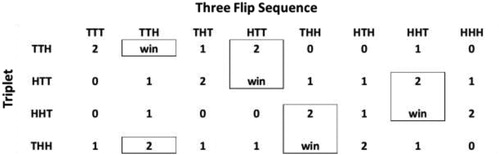
Fig. 5 The number of flips into a triplet’s sequence for each three flip sequence. A triplet is superior to the triplet above it (i.e., THH is superior to HHT) and TTH is superior to THH. The boxes show how each superior triplet wins when its inferior triplet is two flips into its sequence.