Figures & data
Table 1 Framework for identifying statistical computing actions in student’s work.
Table 2 Problem solving phases.
Table 3 Participant background information.
Fig. 1 Interview task.
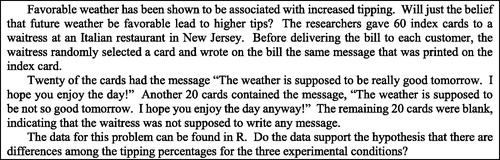
Fig. 2 Script of the data provided to students.
Fig. 3 Sequence of problem solving phases in the task-based interviews.
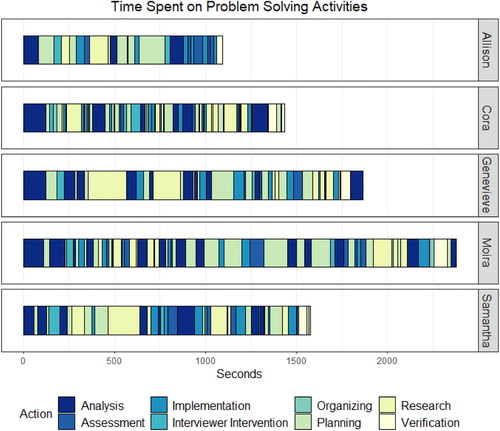
Fig. 4 Proportion of time each student spent in problem solving phases with statistical computing actions overlaid.
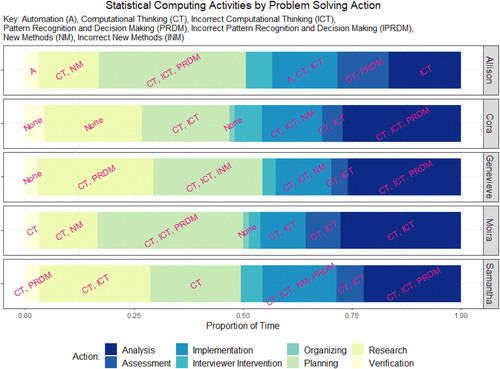
Table 4 Completion of anticipated steps by student.
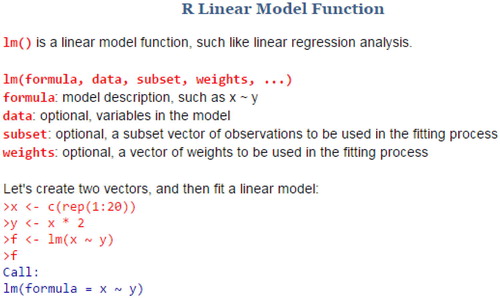
Fig. 5 Website with misleading information utilized by Samantha (http://www.endmemo.com/r/lm.php).
Supplemental material