
Figures & data
Table 1 Bayes table representation for learning about a discrete-valued parameter.
Table 2 Bayes table representation for ED example.
Fig. 1 Comparison of “exact” grid and normal approximation to the marginal posterior of the slope parameter β1 in the two-group logistic model example.
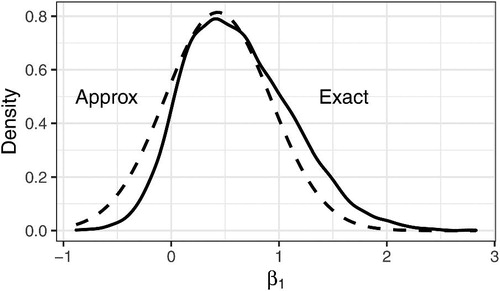
Fig. 2 Histogram of sample means of predicted samples, compared to the actual sample mean (vertical red line).
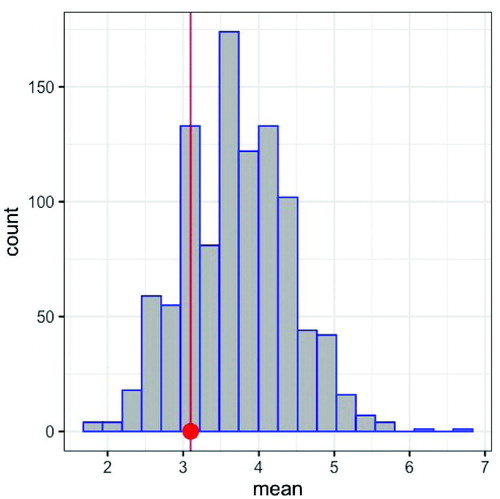
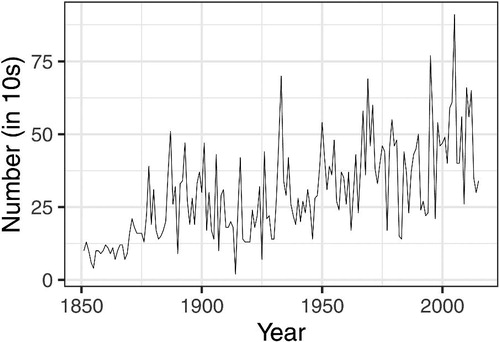
Fig. 3 The distribution of named storms over time, 1851–2015.
Supplemental material