Figures & data
Table 1 Computational skills for multivariable thinking in introductory courses.
Table 2 Summary statistics for confirmed COVID-19 cases as of October 1, 2020 by region.
Fig. 1 Reported confirmed cases per 100,000 inhabitants for countries with at last five million inhabitants and 50 confirmed cases per 100,000 using the tidycovid19 package (Gassen Citation2020). Labeled countries are in the top ten in terms of gross domestic product.
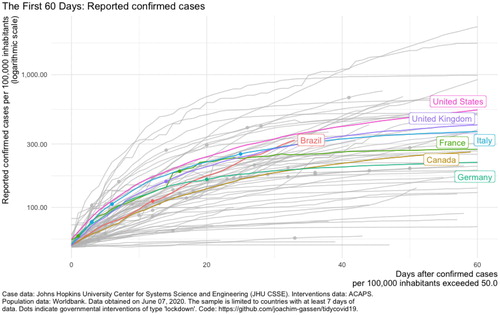
Fig. 2 Confirmed cases (cumulative) as of June 6, 2020 using the tidycovid19 package (Gassen Citation2020).
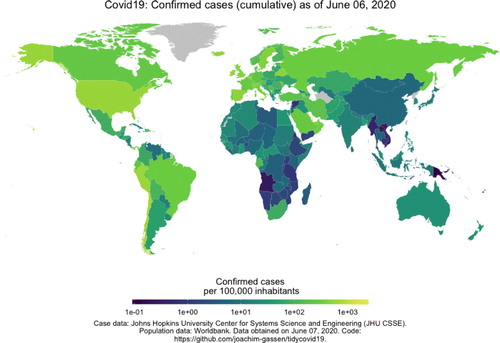
Fig. 3 Confirmed cases per 100,000 inhabitants, gross domestic product per capita, and COVID-19 testing rate by country on May 10, 2020. Labeled countries have one of the world’s ten largest economies.
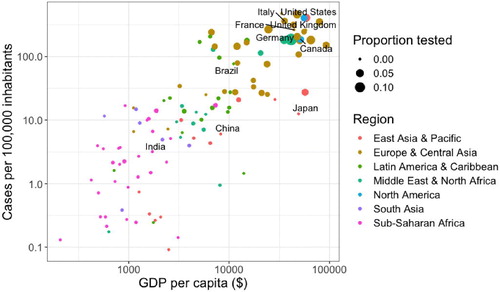
Fig. 4 Mosaic plot depicting participants by political party and whether they believe social media companies censor political viewpoints they find objectionable.
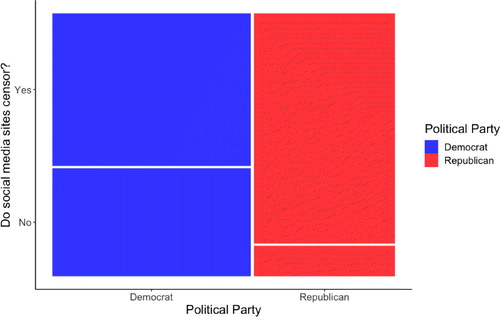
Table 3 Number of participants (percent of column) by political party and whether they believe social media companies censor political viewpoints they find objectionable (Pew Research Center Citation2018).
Table 4 Number of participants (percent of column) by political party, educational attainment, and whether they believe social media companies censor political viewpoints they find objectionable.
Fig. 5 Mosaic plot depicting participants by political party, college graduate status, and whether they believe social media companies censor political viewpoints they find objectionable.
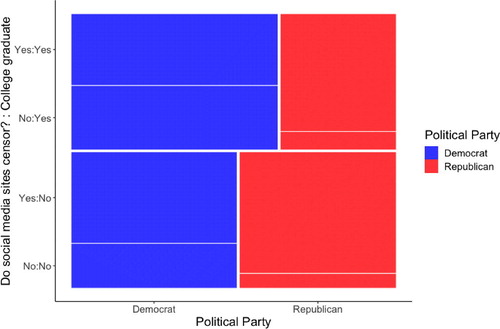
Table 5 Odds ratios (95% C.I.) for believing social media sites censor political viewpoints they find objections comparing Republicans to Democrats and college graduates to noncollege graduates for various models.