Figures & data
Fig. 1 Data analysis cycle (Wickham and Grolemund 2017).
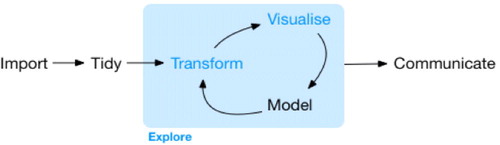
Table 1 Number of faculty members requested for participation and interviewed, by department.
Fig. 2 RStudio Cloud workspace environment for Introduction to R workshop. Every workshop works in an RStudio project, containing a master R Markdown file, a data folder containing the data used in the workshop, and the handout produced for attendees.
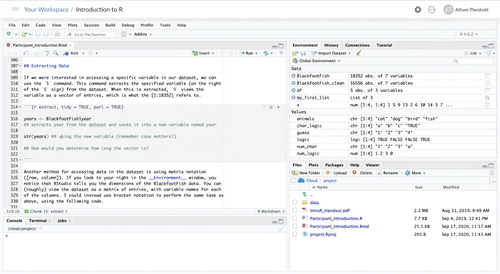
Fig. 3 Number of workshop attendees during the 2018–2019 academic year, by department and current occupation, selected from an itemized list of campus departments and occupations in the pre-workshop survey.
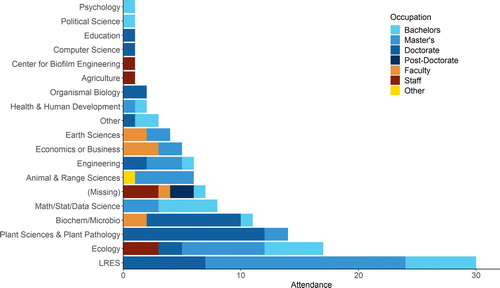
Table 2 Workshop attendees’ responses (n = 121) to the pre-workshop survey question “What are your previous statistical experience(s)? List course names,” thematically organized based on content of the course.