Figures & data
Fig. 1 Source and preview window of the lesson authoring tool. All entered content renders immediately in the live preview, and one can alter existing lessons and templates to adjust them to one’s needs. The editor offers several usability features to make the process of writing lessons easier, including autocompletion, tooltips, and drop-down and configuration menus for inserting components. Here the (opened) drop-down window is used to easily insert any of the configurable ISLE components. A WYSIWYG (What You See Is What You Get) editing mode inside the preview pane allows one to alternatively build lessons without the source view by inserting and customizing attributes through component-specific graphical interfaces.
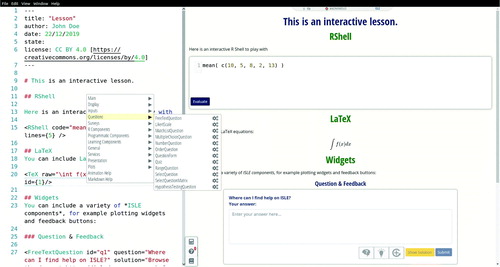
Fig. 2 Screenshot of a data explorer on heart disease. Using the data exploration tool, students (either alone or collaboratively) can generate plots, calculate summary statistics, fit statistical models, and run hypothesis tests. The tool also facilitates data cleaning and transformation of variables and includes a report writing tool, with which students can create data analysis reports (and scientific posters) without having to switch between various tools.
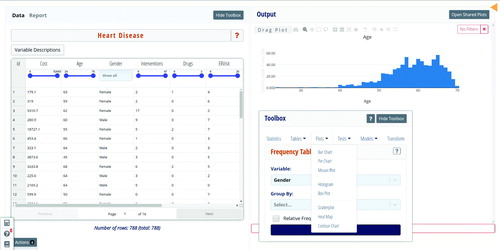
Fig. 3 Screenshot of a sketchpad component for annotating lecture slides. Slides can be overlaid with other interactive components such as questions, data explorers, or simulation widgets.
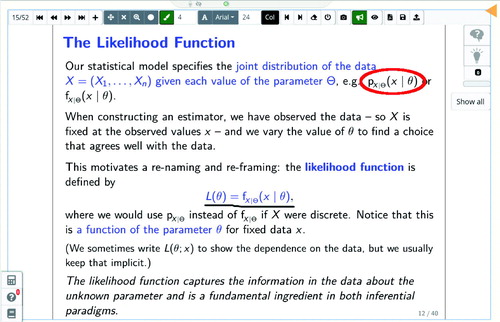
Fig. 4 Screenshot of (hypothetical) student answers to a question asking them to describe the distribution of data in a boxplot. Answers are clustered using real-time k-means as they arrive in class.
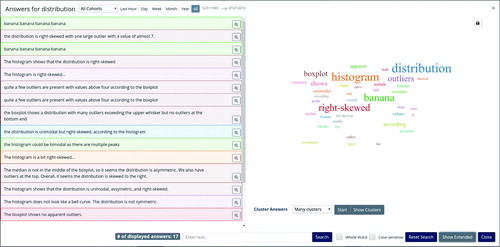
Table 1 Comparison of ISLE with other selected software commonly used for teaching statistics.
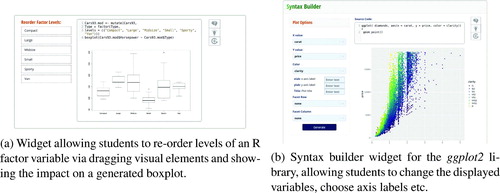
Fig. 5 Screenshots of widgets that allow students to generate a desired output through a point & click interface, while at the same time exposing the underlying R code.