
Figures & data
Table 1. Study design: Two estimated models cross-fitted across three data-generating models.
Figure 1. distribution under correctly- and misspecified models. The dotted line corresponds to the 5% critical value
With
chisquare of the model of interest;
determinant of the model-implied population correlation matrix as an expression of the degree of multivariate dependence; rb within-block correlation. In both scenarios, sample size n = 200. The misspecified model is a multi-factor model for the one-factor model, and vice versa (see also ).
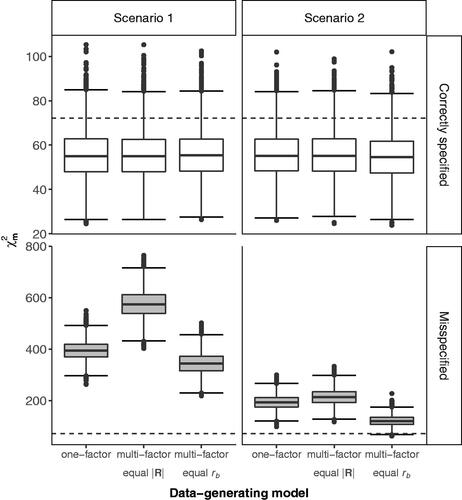
Figure 2. CFI distribution under correctly- and misspecified models. The dotted line corresponds to the commonly adopted .95 CFI rule of thumb. With determinant of the model-implied population correlation matrix as an expression of the degree of multivariate dependence; rb within-block correlation. In both scenarios, sample size n = 200. The misspecified model is a multi-factor model for the one-factor model, and vice versa (see also ).
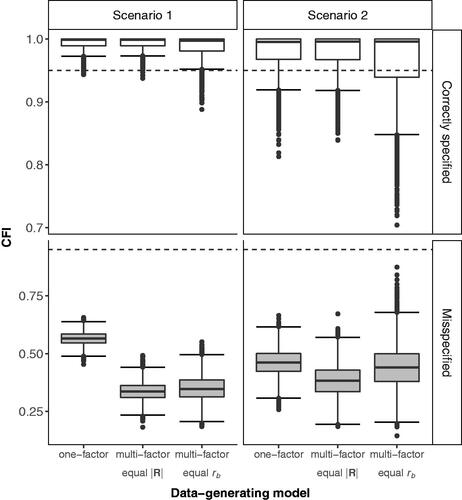
Table B.1. Model comparison results for the set of competing models.