Figures & data
Figure 1. A bivariate random intercept cross-lagged panel model with three waves of data. αt and δt are autoregressive effects of WX and WY, respectively. γt and βt are the cross-lagged effects of on
and
on
respectively. The mean structure with
and
is not explicitly included here.
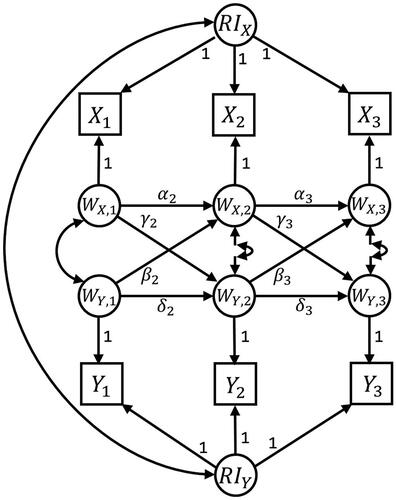
Figure 2. Overview of power analysis procedure used by powRICLPM.
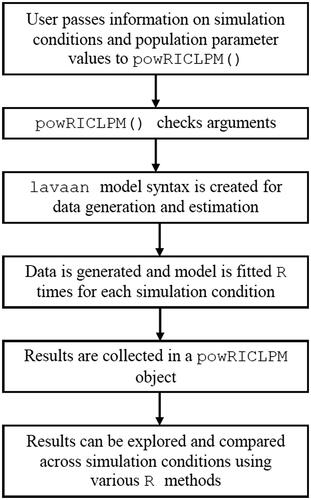
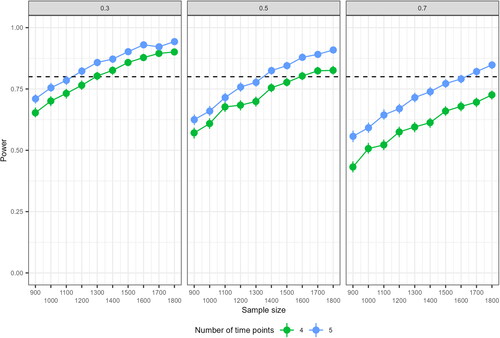
Figure 3. Results of preliminary power analysis for the RI-CLPM, based on 100 replications, for a cross-lagged effect of 0.10 (standardized). The different panels display results for conditions with a 0.3, 0.5 and 0.7 proportion of between-unit variance, respectively. The vertical error bars represent the uncertainty around the simulated power.
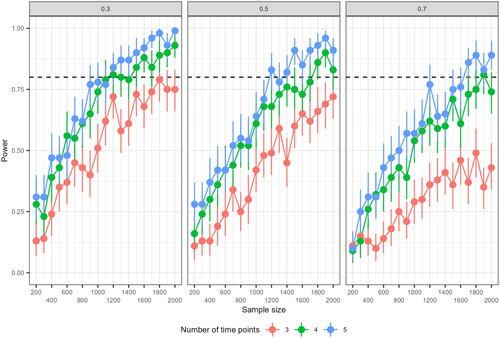
Figure 4. Results of the validation phase of the power analysis for the RI-CLPM, based on 2000 replications. The different panels display results for conditions with a 0.3, 0.5 and 0.7 proportion of between-unit variance, respectively. The vertical error bars represent the uncertainty around the simulated power.