
Figures & data
Figure 1. Latent class model with confounded treatment effect.
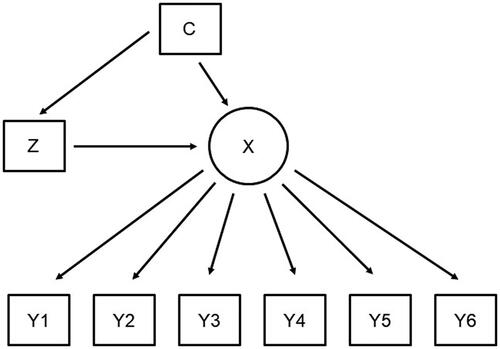
Figure 2. Latent class model with confounded treatment effect where both treatment and the confounders have direct effects on some observed indicators.
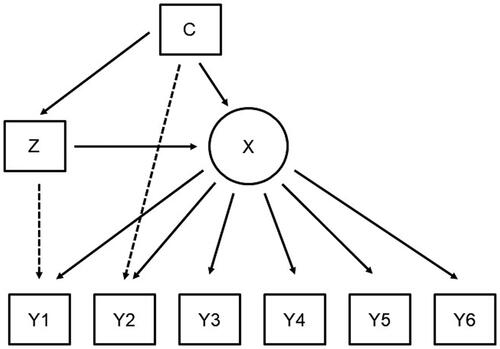
Table 1. Bias of the estimate of the ATE.
Figure 3. Overlap of the propensity scores.
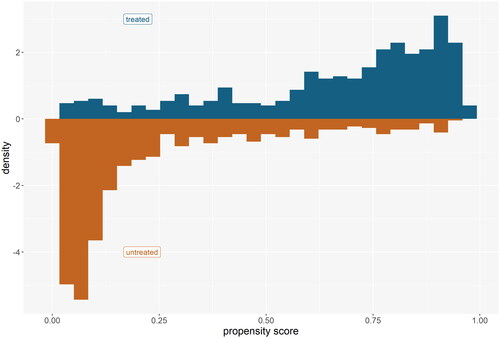
Table 2. Profiles of the two identified classes.
Table 3. Balance of the college enrolled vs. not enrolled group before and after IPW.
Table 4. Class membership probabilities estimated in the last step of our newly proposed analysis strategy.
Table 5. Direct effects between college and alcohol use.
Table 6. Conditional response probabilities for cigarette use per treatment group.
Table 7. Class membership probabilities estimated with the modified analysis strategy based on Lanza et al. (Citation2013).
Table 8. Conditional response probabilities for cigarette use, marijuana use, and crack/cocaine use estimated using the modified analysis strategy based on Lanza et al. (Citation2013).