
Figures & data
Figure 1. The bivariate CLPM for three waves and two observed variables; squares denote the observed variables, circles denote latent variables, triangles represent constants for the mean structure. The latent variables p and q are the grand-mean centered observed variables. Single-headed arrows indicate regression and double-headed arrows indicate correlations or (co)variances. The figure is based on Hamaker et al. (Citation2015).
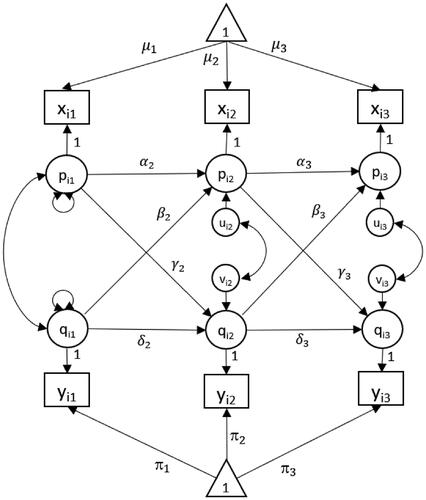
Figure 2. The bivariate RI-CLPM with the separation of within-person and between-person variation for three waves and two observed variables; squares denote the observed variables, circles denote latent variables, triangles represent constants for the mean structure. The variables and
are the person-mean centered observed variables, and
and
are random intercepts. Single-headed arrows indicate regression and double-headed arrows indicate correlations or (co)variances. This figure is based on Hamaker et al. (Citation2015).
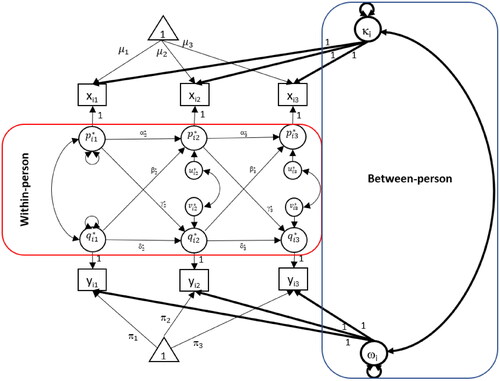
Table 1. Specifications in simulations for bivariate (RI-)CLPM with a total of 144 conditions (2 × 4 × 6 × 3).
Figure 3. An Illustration of how the three-wave data for the first participant (i = 1) is obtained from data generated from the VAR(1) model. This is repeated N times, that is, for each individual.
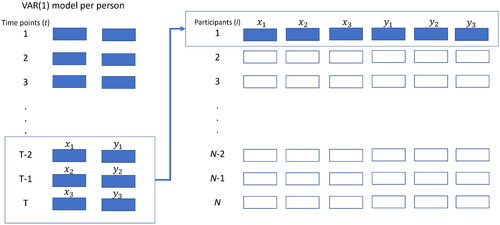
Figure 4. The (true) hypothesis rates when using the GORICA in a bivariate RI-CLPM for all simulation conditions, namely the number of participants (x-axis), the number of waves (different Colored lines), and the three different pairs of cross-lagged parameters ( and
): (a) (
) = (0.1, 0.2), (b) (
) = (0.1, 0.4), and (c) (
) = (-0.07, -0.07). Note that in plots (a) and (b),
is the true hypothesis, while in Plot (c) both
and
are true.
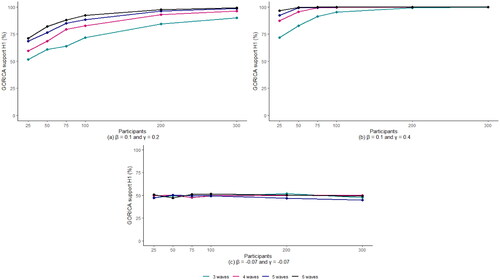
Figure 5. The tri-variate CLPM and tri-variate RI-CLPM; where squares denote the observed variables, circles denote latent variables and triangles represent constants for the mean structure. The latent variables p and q in are the grand-mean centered observed variables, while p, q, and r are the person-mean centered observed variables in . Single-headed arrows indicate regression, double-headed arrows indicate correlations or (co)variances.
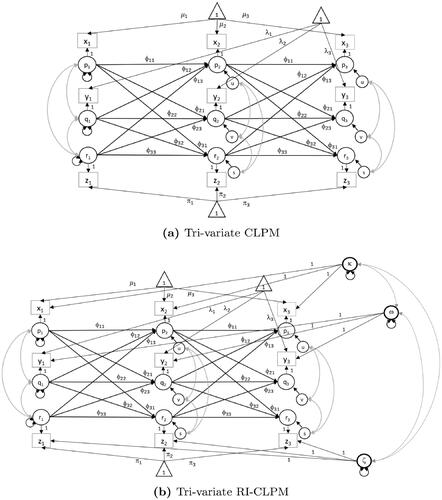
Table 2. Specifications in simulations for tri-variate (RI-)CLPM with a total of 36 conditions (2 × 1 × 6 × 3).
Figure 6. The (true) hypothesis rates when using the GORICA in a tri-variate RI-CLPM for all simulation conditions, namely the number of participants (x-axis) and the three different pairs of cross-lagged parameters (
): (a) (
)= (0.1, 0.2, 0.1, 0.2, 0.1, 0.2), (b) (
)= (0.1, 0.4, 0.1, 0.4, 0.1, 0.4), and (c) (
)= (−0.07, −0.07, −0.07, −0.07, −0.07, −0.07). Note that in plots (a) and (b),
is the true hypothesis, while in Plot (c) both
and its complement are true but
is the most parsimonious one.
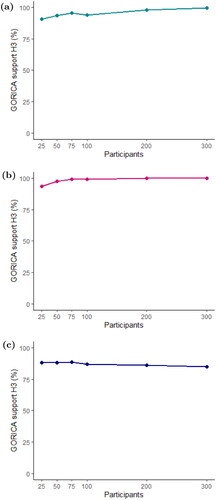
Figure 7. The number of times the incorrect hypotheses (Green) and
(pink) are chosen in a RI-CLPM, for various participant numbers (x-axis) and two cross-lagged parameter specifications: (a) (
)= (0.1, 0.2, 0.1, 0.2, 0.1, 0.2) and (b) (
)= (0.1, 0.4, 0.1, 0.4, 0.1, 0.4).
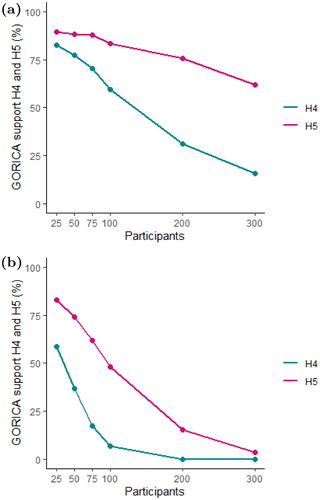
Figure 8. Simplified graph of the RI-CLPM with standardized estimates for the autoregressive parameter estimates and the cross-lagged parameter estimates at time point t and where the standardized cross-lagged paths are constrained to be the same across time.
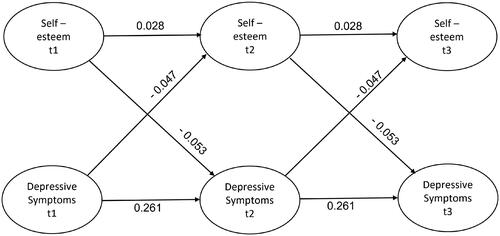
Figure 9. Simplified graph of the RI-CLPM with standardized coefficients for the autoregressive parameter estimates and the cross-lagged parameter estimates at time point t and in a wave-specific parameters model.
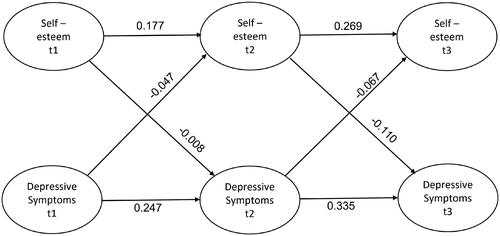
Table 3. GORICA values and weights for the hypotheses of interest ( and its complement) in a wave-independent parameters model.
Table 4. GORICA values and weights for the hypotheses of interest ( and its complement) in a wave-specific parameters model.