Figures & data
Table 1. Parameters of the argon ion exposure (95 MeV/n, LET 270.3 keV/μm)Table Footnotea for HepG2 cells.
Figure 1. Complex DNA damage simulation. Simulations of single and complex DNA damage (per Gy/cell) using Monte Carlo methodologies for the direct effect of low-energy electrons (track-ends) as described in the text. The double strand breaks (DSB), single strand breaks (SSB), base damages (BD) and total strand breaks (TSB) are shown for electron energies 100–10,000 eV. We assume here a diploid cell of DNA size ∼6 Gbp.
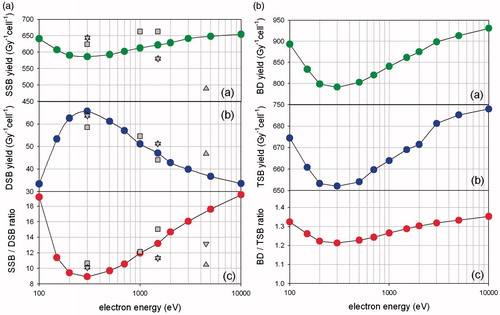
Figure 2. DSB foci induction and repair for varying doses and radiations. We show the dose dependence of induction and repair for DSBs in human DNA repair proficient cells and at different post-irradiation time points. Results of immunofluorescence experiments using two different DSB probes, γ-H2AX and 53BP1. DSB foci numbers have been counted using Imaris software for confocal images (A549, MO59K, MO59J, FEP cell lines) and with JQuantPro (developed by Dr. Pavel N. Lobachevsky based on a previous JCount version [Citation21]) for epifluorescence images (MCF7, HepG2 cell lines). “#” denotes number. Antibodies against γ-H2AX and 53BP1 proteins have been used as DSB surrogate markers. (a) A549 cells irradiated with X-rays or α-particles. (i) γ-Η2ΑΧ foci already for the time point of 2 h have been reduced in numbers. (ii) 53BP1 foci have similar levels with γ-H2AX up to the dose of 2 Gy, but for 4 Gy their number is smaller probably due to 53BP1 protein cellular levels “consumption”. (iii) A549 cells irradiated with α-particles: α-particles induce bigger but fewer γ-H2AX foci. For the 2-h time point, foci are still forming, because of DSB clustering. At the 1-h time point foci are present but not big enough in size to be detected. (b) HepG2 cells irradiated with X-rays (i) or Argon ions (ii). (c) Dose dependence of γ-Η2ΑΧ foci number per cell, regarding the first time point (≤ 1 h), for several cell lines. Linear fitting is presented for γ-rays, X-rays, α-particles and 36Ar ions. The trendlines and linear fitting coefficients are also included in each case. Values have been obtained out of 2–3 independent experiments. “*” Denotes statistical difference at the p < .05 level between irradiated and non-irradiated (0 Gy) samples. “**” Denotes statistical difference at the p < .05 level between various repair time points and initial “0” h time point before actual repair samples.
![Figure 2. DSB foci induction and repair for varying doses and radiations. We show the dose dependence of induction and repair for DSBs in human DNA repair proficient cells and at different post-irradiation time points. Results of immunofluorescence experiments using two different DSB probes, γ-H2AX and 53BP1. DSB foci numbers have been counted using Imaris software for confocal images (A549, MO59K, MO59J, FEP cell lines) and with JQuantPro (developed by Dr. Pavel N. Lobachevsky based on a previous JCount version [Citation21]) for epifluorescence images (MCF7, HepG2 cell lines). “#” denotes number. Antibodies against γ-H2AX and 53BP1 proteins have been used as DSB surrogate markers. (a) A549 cells irradiated with X-rays or α-particles. (i) γ-Η2ΑΧ foci already for the time point of 2 h have been reduced in numbers. (ii) 53BP1 foci have similar levels with γ-H2AX up to the dose of 2 Gy, but for 4 Gy their number is smaller probably due to 53BP1 protein cellular levels “consumption”. (iii) A549 cells irradiated with α-particles: α-particles induce bigger but fewer γ-H2AX foci. For the 2-h time point, foci are still forming, because of DSB clustering. At the 1-h time point foci are present but not big enough in size to be detected. (b) HepG2 cells irradiated with X-rays (i) or Argon ions (ii). (c) Dose dependence of γ-Η2ΑΧ foci number per cell, regarding the first time point (≤ 1 h), for several cell lines. Linear fitting is presented for γ-rays, X-rays, α-particles and 36Ar ions. The trendlines and linear fitting coefficients are also included in each case. Values have been obtained out of 2–3 independent experiments. “*” Denotes statistical difference at the p < .05 level between irradiated and non-irradiated (0 Gy) samples. “**” Denotes statistical difference at the p < .05 level between various repair time points and initial “0” h time point before actual repair samples.](/cms/asset/6c3606c5-4c5e-4673-89c8-81c964ff351a/ifra_a_1232484_f0002_c.jpg)
Figure 3. DSB induction and processing under a status of repair deficiency. Results are shown for immunofluorescence experiments at different post-irradiation time points. DSB foci numbers have been counted with Imaris software for confocal images (A549, MO59K, MO59J, FEP cell lines) and with JQuantPro (developed by Dr. Pavel N. Lobachevsky based on a previous JCount version [Citation21]) for epifluorescence images (MCF7, HepG2 cell lines). “#” denotes number. Antibodies against γ-H2AX and 53BP1 proteins have been used as DSB surrogate markers. (a) A549 cells irradiated with X-rays −/+ DNA-PKcs inhibitor NU7441. (i) and (ii) 53BP1 foci number per cell. (iii) and (iv) γ-H2AX foci numbers. (b) MO59K and MO59J cells irradiated with X-rays. (i) and (ii) 53BP1 foci number per cell. (iii) and (iv) γ-H2AX foci number per cell. (c) MCF7 cells irradiated with γ-rays −/+ DNA-PKcs inhibitor NU7026. Values have been obtained out of 2–3 independent experiments. “*” Denotes statistical difference at the p < .05 level between irradiated and non-irradiated (0 Gy) samples. “**” Denotes statistical difference at the p < .05 level between various repair time points and initial “0” h time point before actual repair samples.
![Figure 3. DSB induction and processing under a status of repair deficiency. Results are shown for immunofluorescence experiments at different post-irradiation time points. DSB foci numbers have been counted with Imaris software for confocal images (A549, MO59K, MO59J, FEP cell lines) and with JQuantPro (developed by Dr. Pavel N. Lobachevsky based on a previous JCount version [Citation21]) for epifluorescence images (MCF7, HepG2 cell lines). “#” denotes number. Antibodies against γ-H2AX and 53BP1 proteins have been used as DSB surrogate markers. (a) A549 cells irradiated with X-rays −/+ DNA-PKcs inhibitor NU7441. (i) and (ii) 53BP1 foci number per cell. (iii) and (iv) γ-H2AX foci numbers. (b) MO59K and MO59J cells irradiated with X-rays. (i) and (ii) 53BP1 foci number per cell. (iii) and (iv) γ-H2AX foci number per cell. (c) MCF7 cells irradiated with γ-rays −/+ DNA-PKcs inhibitor NU7026. Values have been obtained out of 2–3 independent experiments. “*” Denotes statistical difference at the p < .05 level between irradiated and non-irradiated (0 Gy) samples. “**” Denotes statistical difference at the p < .05 level between various repair time points and initial “0” h time point before actual repair samples.](/cms/asset/391b6fe2-7272-493f-b9a6-b2d9d4060765/ifra_a_1232484_f0003_c.jpg)
Figure 4. Clustering of damage revealed by means of colocalization parameters. Estimation of colocalization between DSB or DSB and non-DSB DNA repair proteins using adaptations of immunofluorescence methodologies. Colocalization levels have been estimated with Imaris software for confocal images (A549, MO59K, MO59J, FEP cell lines) and with JQuantPro (developed by Dr. Pavel N. Lobachevsky based on a JCount version [Citation21]) for epifluorescence images (MCF7, HepG2 cell lines). Antibodies against γ-H2AX and 53BP1 proteins have been used as DSB surrogate markers. For visualization of non-DSB lesions antibodies against OGG1 and APE1 proteins have been used as probes. For estimation of colocalization between γ-Η2ΑΧ and 53BP1, a classic colocalization approach has been adopted. It is expressed as the percentage (denoted as “% clc”) of colocalized γ-H2AX foci to total γ-Η2ΑΧ foci number in the nucleus. For colocalization between DSB and non-DSB proteins, Pclc recently introduced by our group-parameter has been utilized. Pclc expresses the relative concentration of non-DSB protein in the DSB foci area compared to the rest of cell nucleus area. Scale of Pclc: inverse colocalization 0 < Pclc < 1, random colocalization Pclc∼1 and true colocalization Pclc > 1 [Citation19]. (a) Calculation of colocalization between DSB and non-DSB repair proteins using Pclc. (i), (ii) HepG2 cells irradiated with X-rays or Argon ions. (iii)–(v) A549 cells irradiated with X-rays, α-particles or Micro Léman collimated X-rays. (vi) MCF7 cells exposed to γ-rays and (vii) FEP cells irradiated with γ-rays. (b) Non-DSB foci number per cell for various radiations. (c) Calculation of colocalization levels between 53BP1 and γ-Η2ΑΧ DSB repair proteins. (i) and (ii) MO59K and MO59J cells irradiated with X-rays at various doses. Values have been obtained out of 2–3 independent experiments. “*” Denotes statistical difference at the p < .05 level between irradiated and non-irradiated (0 Gy) samples. “**” Denotes statistical difference at the p < .05 level between various repair time points and initial “0” h time point before actual repair samples.
![Figure 4. Clustering of damage revealed by means of colocalization parameters. Estimation of colocalization between DSB or DSB and non-DSB DNA repair proteins using adaptations of immunofluorescence methodologies. Colocalization levels have been estimated with Imaris software for confocal images (A549, MO59K, MO59J, FEP cell lines) and with JQuantPro (developed by Dr. Pavel N. Lobachevsky based on a JCount version [Citation21]) for epifluorescence images (MCF7, HepG2 cell lines). Antibodies against γ-H2AX and 53BP1 proteins have been used as DSB surrogate markers. For visualization of non-DSB lesions antibodies against OGG1 and APE1 proteins have been used as probes. For estimation of colocalization between γ-Η2ΑΧ and 53BP1, a classic colocalization approach has been adopted. It is expressed as the percentage (denoted as “% clc”) of colocalized γ-H2AX foci to total γ-Η2ΑΧ foci number in the nucleus. For colocalization between DSB and non-DSB proteins, Pclc recently introduced by our group-parameter has been utilized. Pclc expresses the relative concentration of non-DSB protein in the DSB foci area compared to the rest of cell nucleus area. Scale of Pclc: inverse colocalization 0 < Pclc < 1, random colocalization Pclc∼1 and true colocalization Pclc > 1 [Citation19]. (a) Calculation of colocalization between DSB and non-DSB repair proteins using Pclc. (i), (ii) HepG2 cells irradiated with X-rays or Argon ions. (iii)–(v) A549 cells irradiated with X-rays, α-particles or Micro Léman collimated X-rays. (vi) MCF7 cells exposed to γ-rays and (vii) FEP cells irradiated with γ-rays. (b) Non-DSB foci number per cell for various radiations. (c) Calculation of colocalization levels between 53BP1 and γ-Η2ΑΧ DSB repair proteins. (i) and (ii) MO59K and MO59J cells irradiated with X-rays at various doses. Values have been obtained out of 2–3 independent experiments. “*” Denotes statistical difference at the p < .05 level between irradiated and non-irradiated (0 Gy) samples. “**” Denotes statistical difference at the p < .05 level between various repair time points and initial “0” h time point before actual repair samples.](/cms/asset/d1198e9d-5f9d-4eb2-b56e-217f58c04645/ifra_a_1232484_f0004_c.jpg)