Figures & data
Figure 1. Study design. Mice hearts were harvested at baseline (n = 4), after 30 min of ischemia (n = 3) or after 5 min of reperfusion (n = 4). A single nitrite/sodium chloride dose was administered before reperfusion (n = 4).
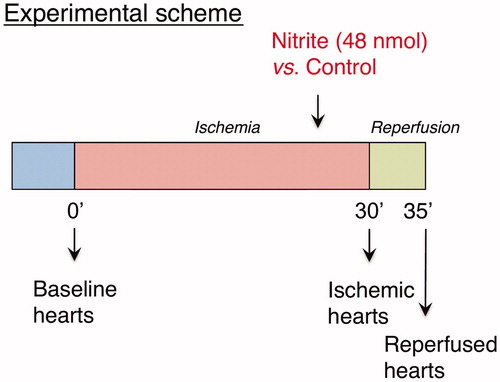
Figure 2. Volcano plots show differential miRNA expression. Depicted miRNAs are differentially regulated in 5 min of reperfusion vs. ischemia control group (A) and in nitrite-treated reperfusion vs. reperfusion control group (B) (ischemia n = 3, reperfusion control n = 4, reperfusion + nitrite n = 4; p < 0.05).
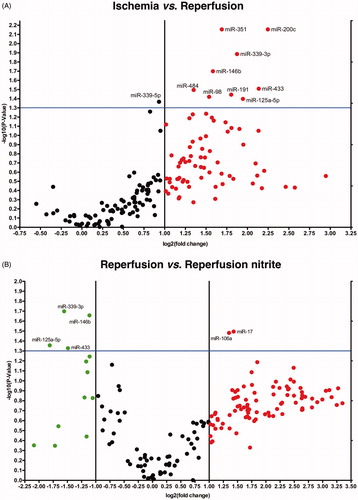
Table 1. Six miRNAs Identified to be down-regulated during 30 min of ischemia.
Table 2. miRNAs identified to be regulated in ischemia/reperfusion injury.
Figure 3. mRNA analysis and pathway analysis using DAVID-software. (A) Reperfused mice with nitrite treatment vs. control group show differentially expressed gene transcripts. (B) DAVID analysis shows three enriched pathways in reperfused mice with nitrite treatment (p < 0.01).
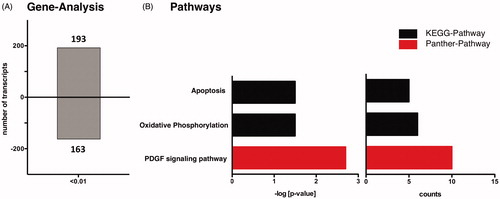
Table 3. Nitrite-induced enriched gene ontology (GO) terms according to biological processes, cellular components and molecular functions within the heart. GO terms are ordered by Fisher’s exact test –log [p value]. Differentially expressed transcripts involved in the term (count) with p < 0.01 were included. FDR, false discovery rate.
Figure 4. Apoptosis pathway in nitrite treated mice after 5 min of reperfusion. Stars indicate differentially regulated genes in reperfusion after nitrite treatment vs. untreated control group (p < 0.01).
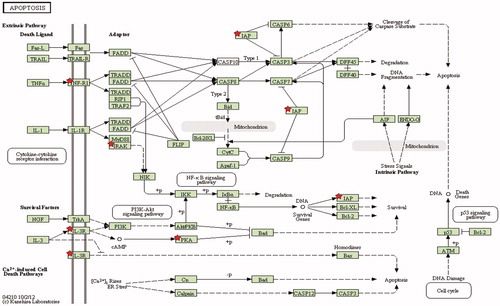
Table 4. Differentially expressed genes related to apoptosis pathway in reperfusion in nitrite treated mice vs. control group.
Table 5. Differentially expressed genes related to oxidative phosphorylation pathway in reperfusion in nitrite treated mice vs. control group.
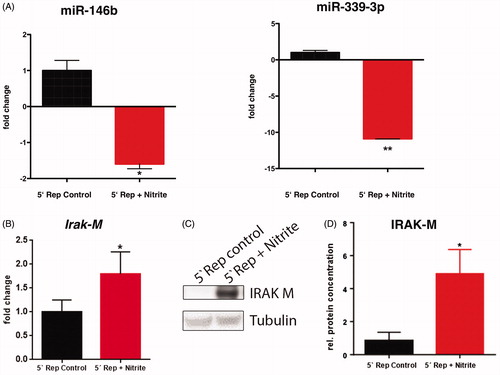
Figure 5. Nitrite treatment is associated with reduced miR-146b and miR-339-3p expression and increased Irak-M transcript and expression level. (A) The levels of miR-146b and miR-339-3p expression were evaluated by real-time quantitative reverse transcription polymerase chain reaction (real-time qRT-PCR) and normalized to sno135. (B) Irak-M transcript level was detected by real time qRT-PCR and normalized to GAPDH transcripts. (C) The protein level of IRAK-M was examined by immunoblotting and tubulin was set as internal control for sample loading. (D) Intensities of IRAK-M bands were normalized to tubulin. Data are presented as mean ± SD (A, B) and SEM (C); n = 4–7; *p < 0.05, **p < 0.01.