Figures & data
Figure 1. BAR and fatty acids impair MCF7 migration. MCF7 cells were seeded (3 × 10⁵ cells/well) in a 12-well plate and incubated overnight. The next day, cells were scratched and synchronized using serum-free media. After 2 h, a low-serum medium was added with and without BAR (50 and 100 nM) and with and without fatty acid (25 μM). Plates were incubated and migration was monitored in the Cell-IQ system for up to 72 h. (A) Increasing BAR for up to 24 h; (B) BAR in the presence and absence of oleate; and (C) BAR in the presence and absence of palmitate. Results are expressed as the mean ± standard error of mean (SEM) of at least three independent experiments where asterisk represents p < 0.05 compared to untreated control and hash represents p < 0.05 by two-way ANOVA for time and treatment.
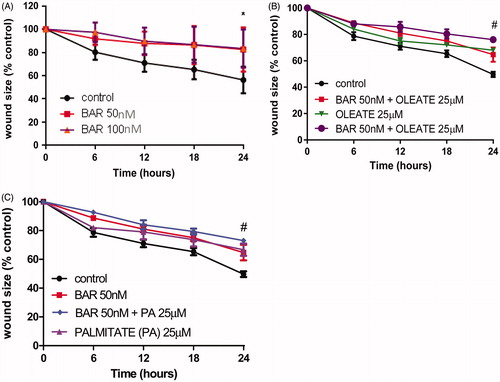
Figure 2. BAR impairs MCF7 mitochondrial activity. MCF7 cells were seeded at a density of 5 × 10⁴ cells/ml, allowed to adhere overnight, then exposed to treatment for up to 48 h. MTT reagent (0.5 mg/ml in PBS) was added and incubated with cells for the final 4 h. (A) Increasing BAR concentration over 24 h. (B) Increasing BAR concentration over 24 h. (C) Co-incubation with increasing BAR concentration in the presence of palmitate (25 μM) for 24 h; and (D) 48 h. Results are expressed as the mean ± standard error of mean (SEM) of at least three independent experiments where, **p < 0.01, ***p < 0.005 and ****p < 0.0001. Hash represents p < 0.05 for palmitate treatment compared to no palmitate treatment.
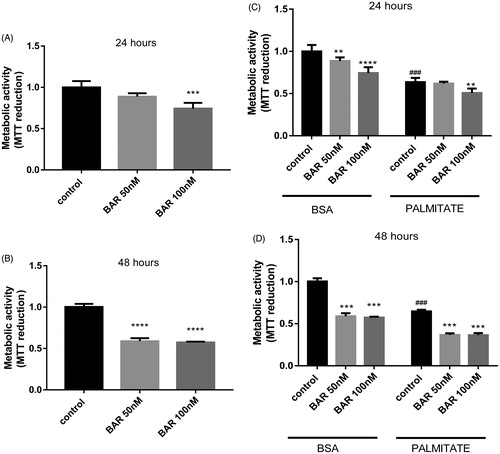
Figure 3. BAR affects MCF7 antioxidant gene expression relative to YWHAZ and increases oxidative stress. MCF7 cells were seeded (3 × 10⁵ cells/well) overnight prior to treatment with BAR (0–100 nM), palmitate (25 μM) and rosiglitazone for 24 h. Cells were removed by scraping and RNA was extracted for qPCR analysis of (A) GCLC; (B) UCP1; and (E) SOD2 mRNA. (C) For measuring oxidative stress, superoxide was determined in MCF7 by incubating with MitoSOX Red (1.25 μM) for 30 min prior to scraping and analysis by flow cytometry and (D) GSH was determined using the recycling assay. Results are expressed as the mean ± standard error of mean of at least three independent experiments where asterisk represents p < 0.05, **p < 0.01, ***p < 0.005 and ****p < 0.0001. Hash represents p < 0.05 for palmitate treatment compared to no palmitate treatment.
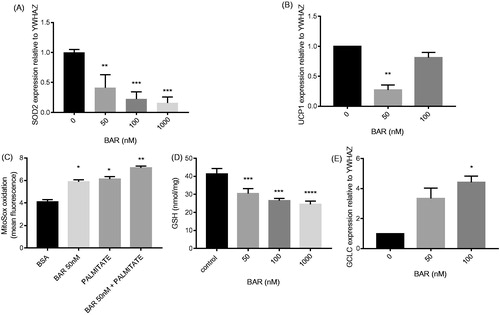
Figure 4. BAR impairs metabolism in MCF7 cells and this effect is prevented by incubation with NAC. ECAR and OCRs were measured in MCF7 cells under basal conditions and using the MitoStress test using XF-24 Extracellular Flux Analyzer (A) OCR with increasing concentration of BAR for 24 h; (B) ECAR with increasing concentration of BAR for 24 h; (C) metabolic activity with increasing concentration of BAR in the presence of 3 mM NAC for 24 h; and (D) for 48 h. Results are expressed as the mean ± standard error of mean of at least three independent experiments where asterisk represents p < 0.05, **p < 0.01 and ***p < 0.005.
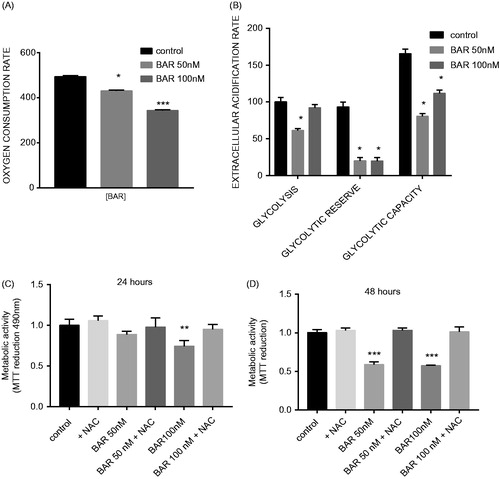
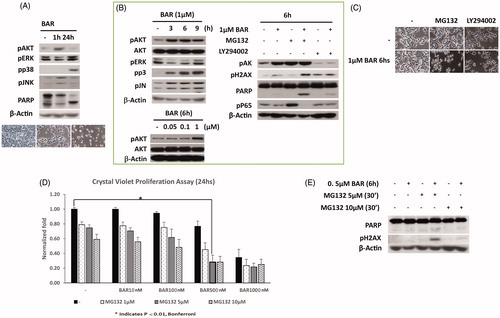
Figure 5. BAR activates AKT within 6 h and later activates the DNA damage response and NFkB signalling. MCF7 cells were seeded (3 × 10⁵ cells/well) overnight prior to treatment with BAR in the presence and absence of MG132 (proteasome inhibitor) and LY294002 (AKT inhibitor). MCF7 cells were exposed to BAR (1 μM) for up to 24 h and then were collected in lysis buffer for light microscopy (A) or Western blotting to interrogate key signalling pathways. (B) Signalling events were studied by Western blotting for up to 9 h BAR treatment (1 μM). (C) Effect of MG132 and LY294002 co-incubation with BAR for 6 h on cell morphology viewed by light microscopy. (D) Crystal violet proliferation assay for BAR (10–1000 nM) incubated with increasing concentrations of MG132 and results are expressed as the mean ± standard error of mean of at least three independent experiments where asterisk represents p < 0.05, and (E) the synergistic effect of NFkB inhibition on the DNA damage response.