
Figures & data
Table 1. Baseline characterisations of the subjects.
Figure 1. Design of the 9-week placebo-controlled intervention study. w: week; h: hour.
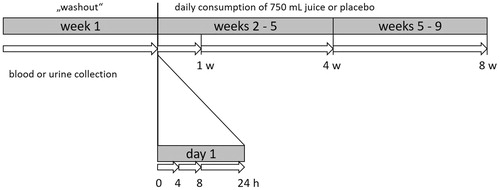
Table 2. Composition of the anthocyanin-rich fruit juice and placebo drink.
Table 3. Average daily energy and nutrient intakes of volunteers, based on 7-day food records completed in the last week of the wash-out period, four and 8 weeks of intervention prior to blood and urine sampling (wo: wash out, w: weeks).
Figure 2. Changes in the body fat and fat free mass of volunteers in both groups during the intervention in comparison to the wash-out period: (A) juice group (n = 30); (B) placebo group (n = 27). Data are presented as mean values and SD of differences. Significant differences in body composition relative to the wash-out period: ***p < 0.001, **p < 0.01, *p < 0.05.
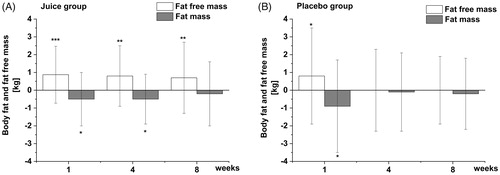
Table 4. Body weight and composition of volunteers after the wash-out period and after 1, 4 and 8 weeks of intervention.
Figure 3. Background and total DNA strand breaks in (A) juice group (n = 30) and (B) in placebo group (n = 27) during the study. Data are expressed as tail intensity in % (TI%) with mean values and SD; significant differences in comparison to the wash-out: ***p < 0.001, **p < 0.01, *p < 0.05.
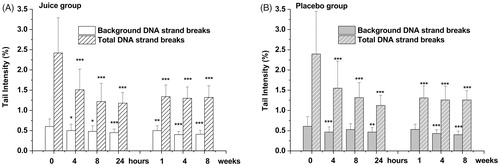
Table 5. The effects of study beverages on blood plasma parameters throughout the study period.