
Figures & data
Table 1. Classification of radiation.
Figure 1. Difference in dose distribution between photon irradiation and heavy-ion beam irradiation. (A) Schematic drawing of the geometry of photon irradiation and dose distribution. (B) Schematic drawing of heavy-ion beam irradiation and dose distribution. The range and position of the spread-out Bragg peak (SOBP) was adjusted on the target tissue using a ridge filter (RF) and binary filter (BF). The thickness of the RF determines the SOBP thickness. The thickness of BF determines the depth of the total beam end, i.e. the SOBP can be shifted by changing the BF thickness.
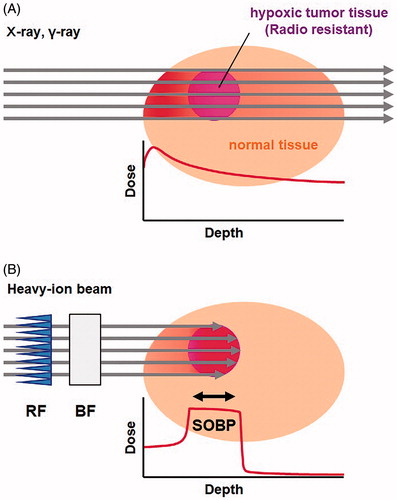
Figure 2. Typical 3-phase profile of the concentration of DMPO-OH plotted versus the density of DMPO observed by X-ray irradiation. The vertical down arrow through the inflection point of the 1st phase (solid gray circles) and 2nd phase (open circles) indicates the density of relatively sparse •OH generation, and the density was estimated to be 141.3 μm−1, which was converted to 7.1 nm as the intermolecular distance and to 4.7 mM as the local concentration. The horizontal left arrow through the inflection point of the 1st phase and 2nd phase indicates the average yield of DMPO-OH in large sample volume. The 3rd phase (solid black circles) may continue to increase, but the end of 3rd phase was not observed in this experiment. The highest density of DMPO used was 1111 μm−1, which corresponds to 0.9 nm as the molecular distance and 2278 mM as the concentration. The figure was partly modified from a previous report [Citation46].
![Figure 2. Typical 3-phase profile of the concentration of DMPO-OH plotted versus the density of DMPO observed by X-ray irradiation. The vertical down arrow through the inflection point of the 1st phase (solid gray circles) and 2nd phase (open circles) indicates the density of relatively sparse •OH generation, and the density was estimated to be 141.3 μm−1, which was converted to 7.1 nm as the intermolecular distance and to 4.7 mM as the local concentration. The horizontal left arrow through the inflection point of the 1st phase and 2nd phase indicates the average yield of DMPO-OH in large sample volume. The 3rd phase (solid black circles) may continue to increase, but the end of 3rd phase was not observed in this experiment. The highest density of DMPO used was 1111 μm−1, which corresponds to 0.9 nm as the molecular distance and 2278 mM as the concentration. The figure was partly modified from a previous report [Citation46].](/cms/asset/408cda81-e3aa-4266-b134-15cc249f372e/ifra_a_1899171_f0002_c.jpg)
Figure 3. The 2-phase profile observed by plotting high-concentration H2O2-induced TEMPOL reduction versus the density of TEMPOL in the sample solution. The vertical down arrow through the inflection point indicates a density of the high-concentration H2O2 clusters, and the density was estimated to be 24.8 μm−1, which was converted to 40.3 nm as the interspace distance of the clusters. The figure was partly modified from a previous report [Citation46].
![Figure 3. The 2-phase profile observed by plotting high-concentration H2O2-induced TEMPOL reduction versus the density of TEMPOL in the sample solution. The vertical down arrow through the inflection point indicates a density of the high-concentration H2O2 clusters, and the density was estimated to be 24.8 μm−1, which was converted to 40.3 nm as the interspace distance of the clusters. The figure was partly modified from a previous report [Citation46].](/cms/asset/f7786978-8e60-489b-b7b5-08e0cd0a9d00/ifra_a_1899171_f0003_c.jpg)
Figure 4. Visualized distribution of high-concentration H2O2 clusters in a gelatin sample. (A) R1 (= 1/T1) map of the gelatin sample containing 2 mM TEMPOL irradiated by 200-Gy carbon-ion beams at the surface. Matrix size = 128 × 128, field of view = 80 × 80 mm, slice thickness = 2 mm. The upper half of surface side was slightly darkened due to the reduction of TEMPOL. (B) Profile of percentage decay of MR signal (solid black line) in the irradiated part of the sample. The radio-activation profile in the gelatin measured at the same time was overlapped (gray line). The figure was partly modified from our previous report [Citation50].
![Figure 4. Visualized distribution of high-concentration H2O2 clusters in a gelatin sample. (A) R1 (= 1/T1) map of the gelatin sample containing 2 mM TEMPOL irradiated by 200-Gy carbon-ion beams at the surface. Matrix size = 128 × 128, field of view = 80 × 80 mm, slice thickness = 2 mm. The upper half of surface side was slightly darkened due to the reduction of TEMPOL. (B) Profile of percentage decay of MR signal (solid black line) in the irradiated part of the sample. The radio-activation profile in the gelatin measured at the same time was overlapped (gray line). The figure was partly modified from our previous report [Citation50].](/cms/asset/8049761a-d921-4a9b-95c6-a2f31fd2087c/ifra_a_1899171_f0004_b.jpg)
Figure 5. Carbon-ion beam-induced total oxidation reaction. Black and gray marks indicate the results of aerobic and hypoxic experiments, respectively. Marks and error bars indicate the average ± SD of three experiments. A dotted line in the figure indicates the level of 0.35 μmol/L/Gy, which was considered to be from •OH. The difference between aerobic and hypoxic experiments was the contribution of HO2•. The figure was partly modified from our previous report [Citation43].
![Figure 5. Carbon-ion beam-induced total oxidation reaction. Black and gray marks indicate the results of aerobic and hypoxic experiments, respectively. Marks and error bars indicate the average ± SD of three experiments. A dotted line in the figure indicates the level of 0.35 μmol/L/Gy, which was considered to be from •OH. The difference between aerobic and hypoxic experiments was the contribution of HO2•. The figure was partly modified from our previous report [Citation43].](/cms/asset/9fb9a4da-6496-47aa-b3f6-9423e35deb32/ifra_a_1899171_f0005_b.jpg)
Figure 6. Visualized distribution of oxidative ROS in a gelatin sample. (A) T1-weightedimage of the gelatin sample containing 2 mM TEMPOL and 4 mM GSH irradiated by 200-Gy carbon-ion beams at the surface. Matrix size = 128 × 128, field of view = 80 × 80 mm, slice thickness = 2 mm. The upper half of the surface side was slight darkened due to the reduction of TEMPOL. (B) Profile of percentage decay of MR signal (solid circle with line) in the irradiated part of the sample. The radio-activation profile in the gelatin measured at the same time was overlapped (solid black line). The figure was partly modified from our previous report [Citation52].
![Figure 6. Visualized distribution of oxidative ROS in a gelatin sample. (A) T1-weightedimage of the gelatin sample containing 2 mM TEMPOL and 4 mM GSH irradiated by 200-Gy carbon-ion beams at the surface. Matrix size = 128 × 128, field of view = 80 × 80 mm, slice thickness = 2 mm. The upper half of the surface side was slight darkened due to the reduction of TEMPOL. (B) Profile of percentage decay of MR signal (solid circle with line) in the irradiated part of the sample. The radio-activation profile in the gelatin measured at the same time was overlapped (solid black line). The figure was partly modified from our previous report [Citation52].](/cms/asset/390a4f2f-cb9c-4fa8-9dd5-0e6d93611b86/ifra_a_1899171_f0006_c.jpg)