Figures & data
Figure 1. Schematic drawing of the sample preparation for irradiation under hypoxic conditions. An aliquot (300‒350 μL) of sample solution was sealed in an O2-permeable polyethylene bag using a heat sealer. The samples were moved into a glove box, and then N2 gas was pumped into the glove box to create a 0.5% or less O2 atmosphere. The PTFE tubing or polyethylene bag containing the sample solution was again sealed in an O2-impermeable bag with an O2-absorber and colorimetric O2-indicator.
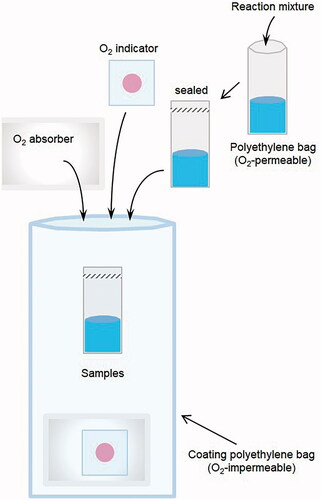
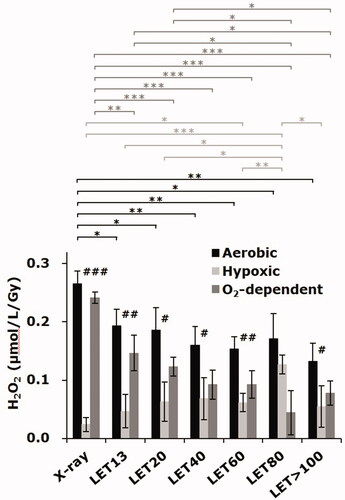
Figure 2. Carbon-ion beam induced H2O2 in water obtained by the UV method. The columns and the error bars indicate the average and SD of three experiments. Each experiment was carried out with triplicate measurements of aerobic and hypoxic samples. The O2-dependent H2O2 yield, which was the difference between averages of aerobic and hypoxic samples, was calculated in each experiment and averaged among three experiments. #, ##, and ### indicate significance between aerobic and hypoxic conditions with p < 0.05, p < 0.01, and p < 0.001, respectively. *, **, and *** indicate significance between the different LET conditions with p < 0.05, p < 0.01, and p < 0.001, respectively.