
Figures & data
Figure 1. Effects of 1-week angiotensin-II treatment on blood pressure and vascular function in rats as previously published. AT-II infusion caused arterial hypertension (increased systolic, mean and diastolic blood pressure) on day 4, 5 and 6, or only on day 6, respectively, as measured by tail cuff plethysmography (A, B, C). Arterial hypertension was associated with endothelial dysfunction (impaired acetylcholine, ACh response) but not with smooth muscle dysfunction (unchanged nitroglycerin, NTG response) as measured by isometric tension method using isolated aortic ring segments (D, E). Leukocyte-derived ROS formation (oxidative burst) in whole blood upon stimulation with phorbol ester (PDBu) was increased in AT-II-treated rats as measured by L-012 enhanced chemiluminescence (F). Continuous AT-II infusion increased lucigenin-enhanced chemiluminescence in isolated aortic rings (G). Levels of 2-OH-Pr2+ and Pr2+ were determined by HPLC after ex vivo incubation of the HPr+ probe with freshly isolated aortic tissue (I). Data are presented as mean ± SEM from n = 5–6 (A, B, C, F, G, I) and 12 (D, E) animals/group. p < 0.05: * vs. CTR. Adapted from [Citation26] with permission under the Creative Commons Attribution License agreement.
![Figure 1. Effects of 1-week angiotensin-II treatment on blood pressure and vascular function in rats as previously published. AT-II infusion caused arterial hypertension (increased systolic, mean and diastolic blood pressure) on day 4, 5 and 6, or only on day 6, respectively, as measured by tail cuff plethysmography (A, B, C). Arterial hypertension was associated with endothelial dysfunction (impaired acetylcholine, ACh response) but not with smooth muscle dysfunction (unchanged nitroglycerin, NTG response) as measured by isometric tension method using isolated aortic ring segments (D, E). Leukocyte-derived ROS formation (oxidative burst) in whole blood upon stimulation with phorbol ester (PDBu) was increased in AT-II-treated rats as measured by L-012 enhanced chemiluminescence (F). Continuous AT-II infusion increased lucigenin-enhanced chemiluminescence in isolated aortic rings (G). Levels of 2-OH-Pr2+ and Pr2+ were determined by HPLC after ex vivo incubation of the HPr+ probe with freshly isolated aortic tissue (I). Data are presented as mean ± SEM from n = 5–6 (A, B, C, F, G, I) and 12 (D, E) animals/group. p < 0.05: * vs. CTR. Adapted from [Citation26] with permission under the Creative Commons Attribution License agreement.](/cms/asset/d227c765-57c7-40b3-9315-48e01690854a/ifra_a_2016735_f0001_c.jpg)
Figure 2. Schematic overview of glutathione detection methods. (A) Mechanism of derivatization of reduced thiols by Ellman’s reagent (DTNB) along with representative chromatograms of standards from HPLC analysis with UV/Vis detection. (B) Principle of electrochemical detection of GSH accompanied by representative chromatograms of standards from HPLC analysis. (C) Principle of photometric GSH and GSSG detection with the Oxiselect assay kit, combined with glutathione reductase dependent reduction of GSSG. (D) Calibration curves are shown for each assay.
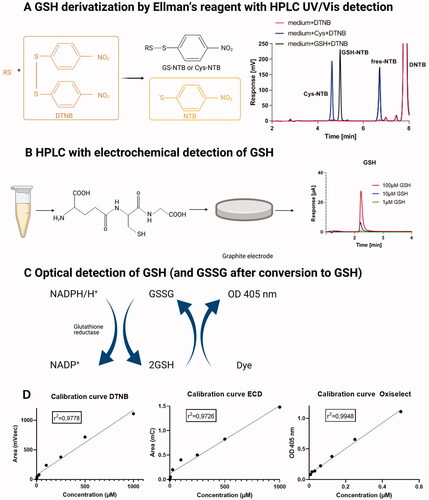
Figure 3. Effects of 1-week angiotensin-II treatment on GSH concentrations measured by HPLC/ECD. Levels of GSH were determined in freshly prepared tissue extracts using an HPLC method with direct electrochemical detection in the heart (A), kidney (B), liver (C), brain (D), plasma (E), serum (F) freshly isolated from control or AT-II-infused rats. For calculation of real tissue or fluid GSH concentrations, dilution factors of 1:20 (for tissues) and 1:2 (for fluids) must be considered. (a-f) Representative chromatograms are shown for all measurements. Data are presented as mean ± SEM from n = 7–9 (A–F). p < 0.05: * versus CTR.
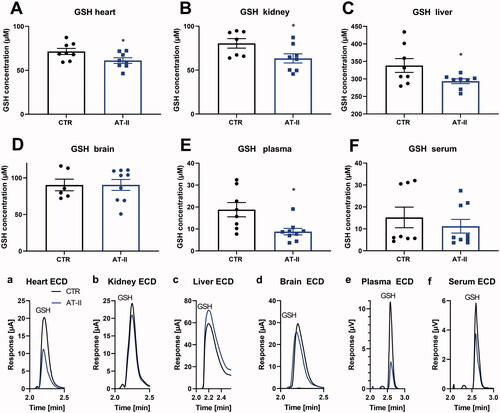
Figure 4. Effects of one-week angiotensin-II treatment on GSH/GSSG ratios measured by HPLC/ECD. Ratios of GSH/GSSG were determined in freshly prepared tissue extracts using a HPLC method with direct electrochemical detection in the heart (A), kidney (B), liver (C), brain(D), plasma (E), serum (F) freshly isolated from control or AT-II-infused rats. (a–f) Representative chromatograms are shown for all measurements. Data are presented as mean ± SEM from n = 4 (A–F). p < 0.05: * vs. CTR.
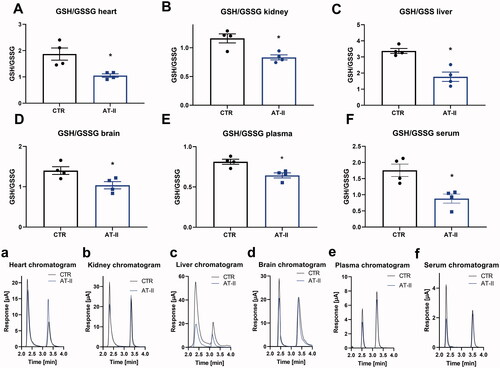
Figure 5. Effects of one-week angiotensin-II treatment on free NTB levels measured by HPLC/Ellman’s reagent quantification. Levels of free NTB (formed from all reduced thiols, for example, GSH, cysteine but also protein-bound) were determined in freshly prepared tissue extracts using Ellman’s reagent derivatization of reduced thiols combined to an HPLC method with UV detection in the heart (A), kidney (B), liver (C), brain (D), plasma (E), serum (F) freshly isolated from control or AT-II-infused rats. For calculation of real tissue or fluid concentrations of reduced thiols, dilution factors of 1:20 (for tissues) and 1:2 (for fluids) must be considered.(a,d) Representative chromatograms are shown for heart and brain measurements. Data are presented as mean ± SEM from n = 6–9 (A–F). p < 0.05: * versus CTR.
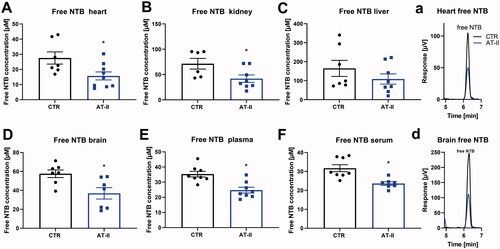
Figure 6. Effects of 1-week angiotensin-II treatment onGS-NTB adduct levels measured by HPLC/Ellman’s reagent quantification. Levels of GS-NTB adduct (formed from reduced GSH) were determined in freshly prepared tissue extracts using Elman’s reagent derivatization of reduced thiols combined with an HPLC method with UV detection in the heart (A), kidney (B), liver (C), brain (D), plasma (E), serum (F) freshly isolated from control or AT-II-infused rats. For calculation of real tissue or fluid GSH concentrations, dilution factors of 1:20 (for tissues) and 1:2 (for fluids) must be considered. (e,f) Representative chromatograms are shown for plasma and serum measurements. Data are presented as mean ± SEM from n = 6–9 (A–F). p < 0.05: * vs. CTR.
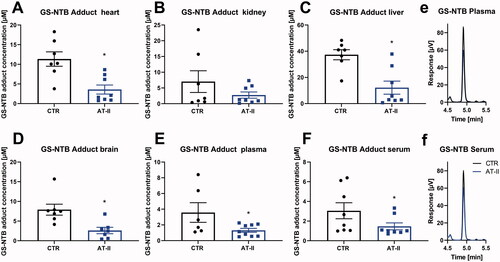
Figure 7. Effects of one-week angiotensin-II treatment on GSH/GSSG ratios by commercial kit determination. Ratio of GSH/GSSG was determined in freshly prepared tissue extracts with Oxiselect assay kit in the stored heart (A), kidney (B), liver (C), brain (D), plasma (E), serum (F) freshly isolated from control or AT-II-infused rats. (G) Absolute concentrations of reduced glutathione in all tissue extracts and fluids comparing control and hypertensive animals. For calculation of real tissue or fluid GSH concentrations, dilution factors of 1:200 (for tissues) and 1:20 (for fluids) must be considered. Data are presented as mean ± SEM from n = 3 (A-G). p < 0.05: * vs. respective CTR.
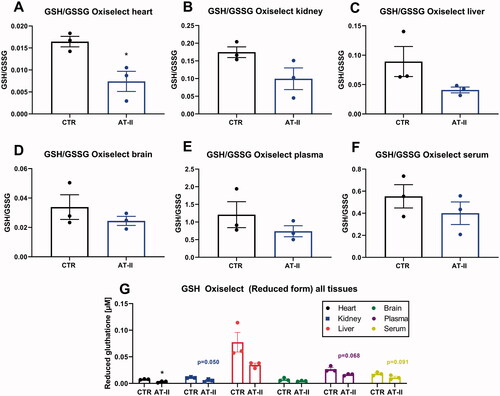
Table 1. GSH, GSSG and GSH/GSSG ratio values in human whole blood samples.
Table 2. GSH, GSSG and GSH/GSSG ratio values in different rat tissue.