Figures & data
Figure 1. Flow cytometry analysis of lipid peroxidation in macrophages. THP-1 macrophages were incubated (A) for 24 h with medium alone and then for 24 h with LDL (200 µg protein/ml) or (B) for 24 h with ferritin (100 µg protein/ml; 0.227 µM) and then for 24 h with ferritin plus LDL (200 µg protein/ml) or (C) for 24 h with ferritin and for 24 h with ferritin alone. The cells were then incubated with Foam-LPO (2 µM) for 15 min at room temperature and analyzed by flow cytometry. The fluorescence in the red channel is shown. (D and E) THP-1 macrophages or (F) human monocyte-derived macrophages were incubated alone or with ferritin (100 µg protein/ml; 0.227 µM) for 24 h. The cells were then incubated for another 24 h without ferritin but with native LDL or sphingomyelinase-modified LDL or with ferritin alone or ferritin together with native LDL or sphingomyelinase-modified LDL (all LDL concentrations were 200 µg protein/ml). The cells were then incubated with Foam-LPO (2 µM) for 15 min at room temperature and analyzed by flow cytometry. Lysosomal lipid peroxidation was quantified by the ratio of mean fluorescence intensity in the green and red channels (FL1/FL2). The control cells were not exposed to ferritin or LDL. *p < 0.05, **p < 0.01, and ***p < 0.001 compared with control cells, ≠≠p < 0.01 and ≠≠≠p < 0.001 for the shown comparison for three independent experiments.
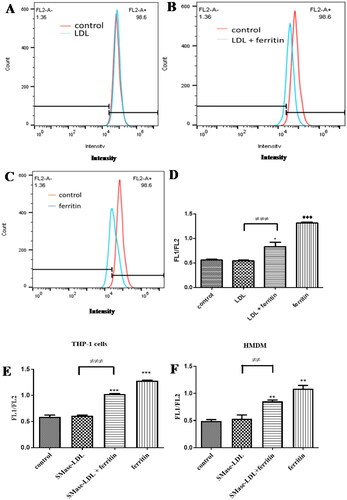
Figure 2. Detection of ceroid in THP-1 macrophages. Some cells were pretreated with ferritin (100 µg protein/ml; 0.227 µM) for 24 h. The cells were then incubated for 24 h with or without native LDL (200 µg protein/ml), sphingomyelinase-modified LDL (200 µg protein/ml) or ferritin (100 µg protein/ml). They were then incubated for 7 days with medium containing 10% (v/v) lipoprotein-deficient serum with or without ferritin (100 µg protein/ml). The “soluble” lipids were removed with ethanol and xylene and the cells stained for ceroid with Oil Red O (A–F). These images are representative of three independent experiments. The levels of ceroid were quantified by ImageJ and presented as percentage ceroid compared with cells incubated with ferritin and SMase-LDL (G). The control cells (No LDL) were not exposed to ferritin or LDL. **p < 0.01 and ***p < 0.001 compared with the cells without LDL. ≠p < 0.05 and ≠≠≠p < 0.001 for the indicated comparison.
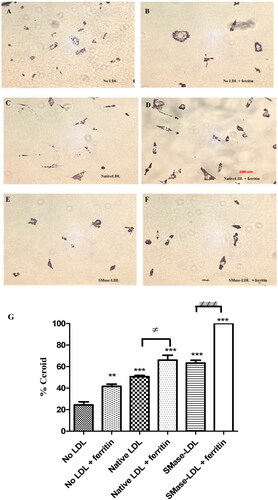
Figure 3. Effect of ferritin and LDL on macrophage metabolism. THP-1 macrophages were incubated for 24 h with or without ferritin (88 µg/ml; 0.2 µM). They were then incubated for 24 h with or without native LDL (100 µg protein/ml) or ferritin (88 µg/ml). The cells were then washed and incubated with medium containing glucose, glutamine and pyruvate as fuels and analyzed using Agilent Seahorse technology to determine their metabolic phenotype before (unfilled squares) and after (filled in squares) being stressed by oligomycin and FCCP. (A) Oxygen consumption rate (OCR), (B) extracellular acidification rate (ECAR), and (C) metabolic profile are shown. The control cells were not exposed to ferritin or LDL. ***p < 0.001 compared with the control cells for four independent experiments.
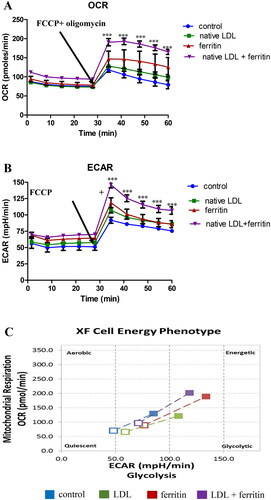
Figure 4. Effect of ferritin-oxidized LDL on intracellular reactive oxygen species formation by THP-1 macrophages. Cells (45,000) were plated on cover slips and incubated for 24 h in (A) RPMI 1640 medium, serum, and antibiotics alone or containing (B) sodium acetate buffer, pH 4.5 (10% (v/v) as a vehicle control, (C) native LDL (50 µg protein/ml), (D) ferritin (44 µg/ml; 0.1 µM), or (E) ferritin-oxidized LDL (50 µg protein/ml). The cells were then washed with PBS and incubated with 10 µM DHE for 30 min in the dark at 37 °C in an incubator without CO2, washed with PBS and mounted using fluorescence mounting medium containing DAPI. (F) The fluorescence intensity was measured with an epifluorescence microscope. The control cells were not exposed to acidic buffer, LDL or ferritin. ***p < 0.001 compared with the control cells. ≠≠≠p < 0.001 for the indicated comparison for three independent experiments.
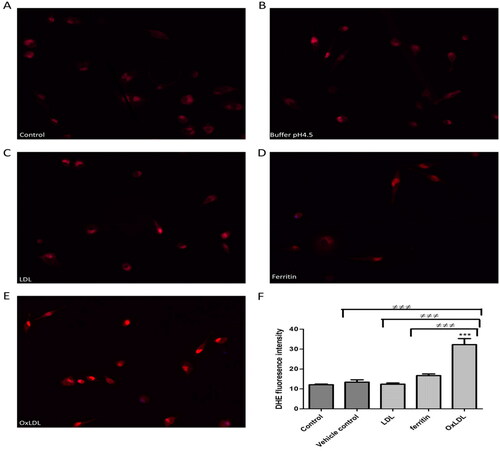
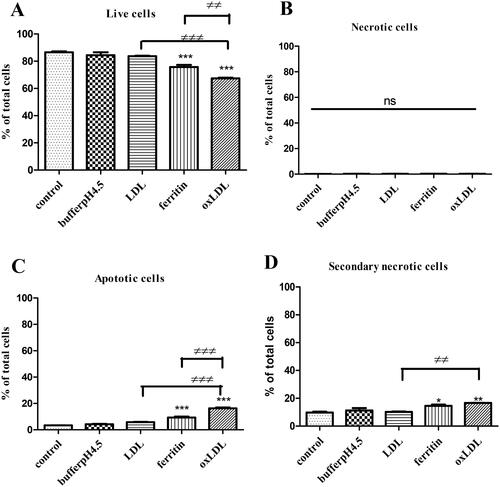
Figure 5. Effects of ferritin-oxidized LDL on apoptosis in THP-1 macrophages. Ferritin-oxidized LDL was prepared by incubating LDL (1 mg protein/ml) with ferritin 880 µg/ml; 2 µM) at 37 °C for 24 h in NaCl/sodium acetate buffer, pH 4.5. THP-1 cells (500,000 cells per well) were cultured in RPMI 1640 containing serum and antibiotics alone or with NaCl/sodium acetate buffer, pH 4.5 (10%), native LDL (100 µg protein/ml), ferritin (88 µg/ml; 0.2 µM) alone or ferritin-oxidized LDL (100 µg protein/ml). After incubation for 48 h, the cells were harvested and assayed by flow cytometry. The percentage of (A) live cells, (B) necrotic cells, (C) apoptotic cells, and (D) secondary necrotic cells are shown. The control cells were not exposed to acidic buffer, LDL, or ferritin. *p < 0.05, **p < 0.01, and ***p < 0.001 compared with the control cells for three independent experiments. ≠≠p < 0.01 and ≠≠≠p < 0.001 for the indicated comparison.