Figures & data
Figure 1. Schematic diagram of the reactor.
The reactor is made of POM and has a structure with four pairs of copper electrodes. The diameter of the gas flow tube is 5 mm.
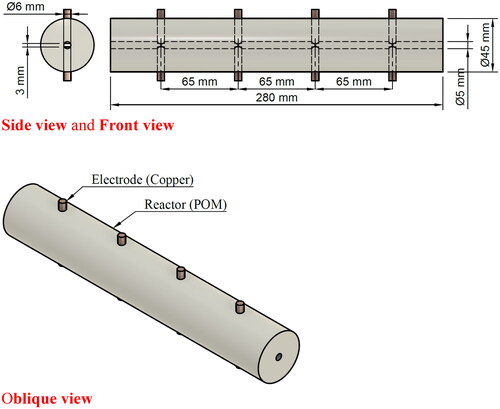
Figure 2. Schematic diagram of the arc discharge treatment and circulation device.
The volume of the circulation tank is about 10 L. During the 20 minutes that the reactor is discharging, the air inside circulates between the tank and the reactor, increasing the concentration of active species.
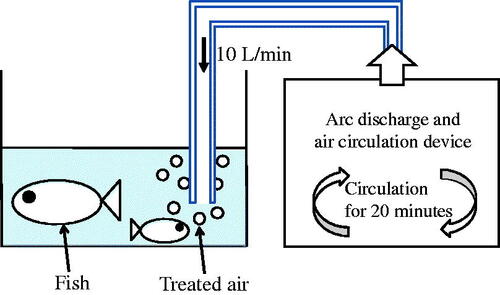
Table 1. Processing sequence and valve open/close status.
Figure 3. Arc discharge generation circuit using RC circuit.
A capacitor is connected in series to drive the discharge in parallel with each electrode.
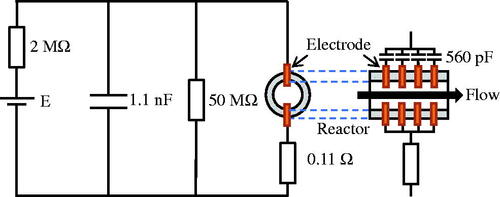
Figure 4. Waveforms of applied voltage and discharge current.
The arc discharge generated in the reactor is pulse-driven by the capacitor charging and discharging. The discharge frequency in the figure was measured to be ∼2.4 kHz, while the actual discharge frequency in the experiment was measured to be ∼152.3 Hz.
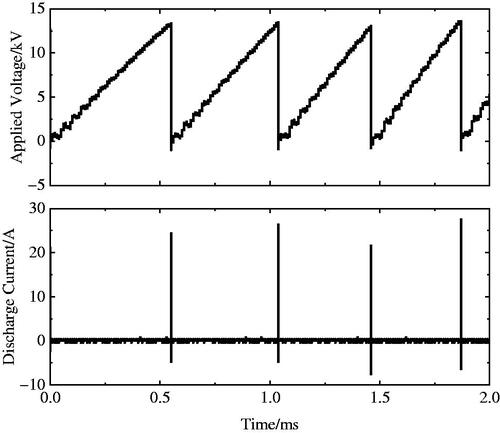
Figure 5. Supply time dependence of NO concentration and cumulative supply amount.
The NO concentration decreased in the first 4 minutes and remained unchanged and constant until 16 minutes.
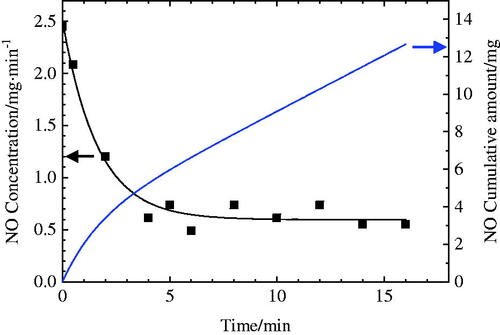
Table 2. Relation between supply time and pH in the aquarium.
Figure 6. Relationship between age in weeks and body length according to the plasma-treated gas supply times.
The straight line in the figure is the least squares fit; the slope changes after 21 weeks of age. The higher the supply, the greater the slope after 21 weeks. However, the individual differences were more significant when feeding was 15 minutes.
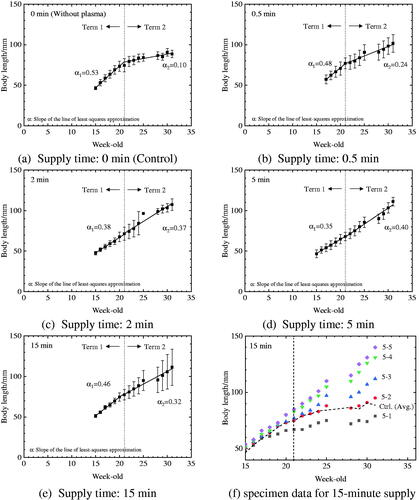
Figure 7. Relationship between average growth rate and age in weeks at each supply time of the plasma-treated gas.
The highest growth rate was observed with 5 minutes, followed by 15 minutes.
At 31 weeks of age, the condition with the highest growth rate was 5 minutes of supply time. The condition with the next highest growth rate was 15 minutes of supply time; more or less than 5 minutes tended to decrease the growth rate, but more so than the control.
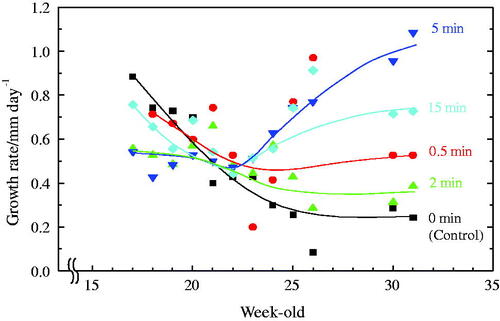
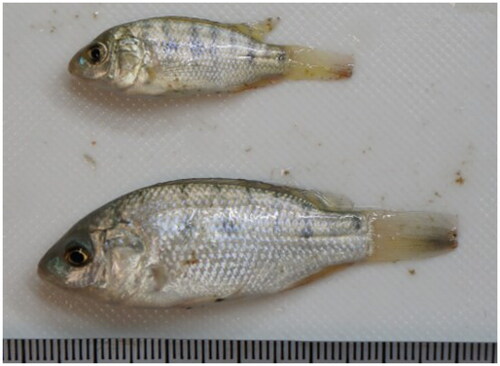
Figure 8. Typical photo of Nile tilapia after the experiment. Top: Sample in the control tank, Bottom: Sample in the tank with the active species.