
Figures & data
Figure 1. Logarithmic diagram of plasmas in density and temperature; Te, Ti, and Tg are the temperatures of electrons, ions, and gases, respectively (thermal plasmas are in an equilibrium state of Te, Ti, and Tg; contrarily, the low temperature or non-thermal or cold plasmas are in a non-equilibrium state among Te, Ti, and Tg. that electrons are differently heated up; the non-equilibrium atmospheric pressure plasma (NEAPP) source can prepare plasmas at ambient temperature under atmospheric pressure for plasma-biological treatments of living organisms and liquids).
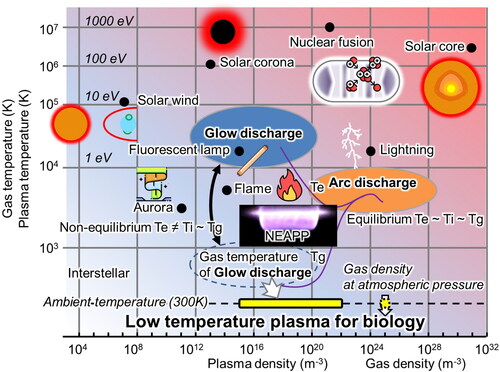
Figure 2. Schematics of plasma sources and configurations of treatments (DBD stands for dielectric barrier discharge) [Citation14] (Reprinted from Jpn J Appl Phys 61, SA0805 (2022)).
![Figure 2. Schematics of plasma sources and configurations of treatments (DBD stands for dielectric barrier discharge) [Citation14] (Reprinted from Jpn J Appl Phys 61, SA0805 (2022)).](/cms/asset/05c77193-b433-4c9c-a484-6f57f6b99d3e/ifra_a_2230351_f0002_c.jpg)
Figure 3. Plasma streamer in a gene transfection device using microdischarge plasma [Citation18] (Reprinted from PLOS One 16, e0245654 (2021)).
![Figure 3. Plasma streamer in a gene transfection device using microdischarge plasma [Citation18] (Reprinted from PLOS One 16, e0245654 (2021)).](/cms/asset/dc4bd8d3-036b-4a62-8641-551fc9db599b/ifra_a_2230351_f0003_c.jpg)
Figure 4. Example of simulation of streamer: (top) calculation setup and conditions, (bottom) spatiotemporal behavior of electron production rate in atmospheric pressure argon discharge when a positive DC voltage of +10 kV is applied to the pin electrode (a region of high electron production arising from the pin electrode shows the generation of a secondary streamer; a similar high-value region from the plane electrode shows a return stroke) [Citation39] (Reprinted from J Phys D 53, 265204 (2020)).
![Figure 4. Example of simulation of streamer: (top) calculation setup and conditions, (bottom) spatiotemporal behavior of electron production rate in atmospheric pressure argon discharge when a positive DC voltage of +10 kV is applied to the pin electrode (a region of high electron production arising from the pin electrode shows the generation of a secondary streamer; a similar high-value region from the plane electrode shows a return stroke) [Citation39] (Reprinted from J Phys D 53, 265204 (2020)).](/cms/asset/0ce12bfe-6f33-42e8-8910-b9bf5f159fef/ifra_a_2230351_f0004_c.jpg)
Figure 5. Three stages of plasma electron generation: (a) first stage (Townsend-glow type discharge), (b) second stage (streamer or bullet type discharge), and (c) third stage (surface type discharge) (reduced electric field (upper row) and electron number density (lower row) in the gas are shown; the first stage of the nearly uniform distributions of an electric field wavefront (streamer head) moves to the second stage of growth of electron number and to the third stage with high density near the dielectric surface) [Citation74] (Reprinted from Appl Phys Express 13, 086001 (2020)).
![Figure 5. Three stages of plasma electron generation: (a) first stage (Townsend-glow type discharge), (b) second stage (streamer or bullet type discharge), and (c) third stage (surface type discharge) (reduced electric field (upper row) and electron number density (lower row) in the gas are shown; the first stage of the nearly uniform distributions of an electric field wavefront (streamer head) moves to the second stage of growth of electron number and to the third stage with high density near the dielectric surface) [Citation74] (Reprinted from Appl Phys Express 13, 086001 (2020)).](/cms/asset/20e0e06f-26f0-421e-8312-52c0ba4d42e2/ifra_a_2230351_f0005_c.jpg)
Figure 6. Non-equilibrium atmospheric pressure plasma system (before the preparation of the plasma-activated solution, the chamber is filled with Ar gas, which flows into three lines of the plasma head, whereas the reactive gases flow only into the center of the three lines) [Citation88] (Reprinted from Plasma Process Polym 17, 1900259 (2020)).
![Figure 6. Non-equilibrium atmospheric pressure plasma system (before the preparation of the plasma-activated solution, the chamber is filled with Ar gas, which flows into three lines of the plasma head, whereas the reactive gases flow only into the center of the three lines) [Citation88] (Reprinted from Plasma Process Polym 17, 1900259 (2020)).](/cms/asset/a50ab856-1d0c-48af-8139-70326c68fa4e/ifra_a_2230351_f0006_c.jpg)
Figure 7. Timeline of the development of representative plasma devices for medical treatments DBD: dielectric barrier discharge, FE-DBD: floating electrode DBD, NEAPP: non-equilibrium atmospheric pressure plasma, LF-jet: low frequency operated jet. Taylor [Citation98], link, Glover [Citation99], Storek [Citation100], Stoffels [Citation101], Kalghatgi [Citation102], Shimizu [Citation103], von Woedtke [Citation104], Kitano [Citation105], Ikehara [Citation106], Kanazawa [Citation7], Neumann [Citation16], Iwasaki [Citation12], and Nakamura [Citation88].
![Figure 7. Timeline of the development of representative plasma devices for medical treatments DBD: dielectric barrier discharge, FE-DBD: floating electrode DBD, NEAPP: non-equilibrium atmospheric pressure plasma, LF-jet: low frequency operated jet. Taylor [Citation98], link, Glover [Citation99], Storek [Citation100], Stoffels [Citation101], Kalghatgi [Citation102], Shimizu [Citation103], von Woedtke [Citation104], Kitano [Citation105], Ikehara [Citation106], Kanazawa [Citation7], Neumann [Citation16], Iwasaki [Citation12], and Nakamura [Citation88].](/cms/asset/6e2ce69a-5d98-432f-9d73-58ef038a706e/ifra_a_2230351_f0007_c.jpg)
Figure 8. Schematic of hierarchical analysis of spatiotemporal measurements. LTS: laser Thomson scattering; E-FISH: electric field induced second harmonic generation; LIF: laser induced fluorescence; ESR: electron spin resonance; LC-MS: liquid chromatography mass spectrometry [Citation107] (Modified from Jpn J Appl Phys 61, SA0805 (2022)).
![Figure 8. Schematic of hierarchical analysis of spatiotemporal measurements. LTS: laser Thomson scattering; E-FISH: electric field induced second harmonic generation; LIF: laser induced fluorescence; ESR: electron spin resonance; LC-MS: liquid chromatography mass spectrometry [Citation107] (Modified from Jpn J Appl Phys 61, SA0805 (2022)).](/cms/asset/b74df743-8c57-4fe2-b4e9-499e374d7168/ifra_a_2230351_f0008_c.jpg)
Figure 9. Absolute densities of O (3P) atom and N (4S°) atom generated by an Ar plasma source [Citation144] (Modified from J Phys D 50, 195202 (2017)).
![Figure 9. Absolute densities of O (3P) atom and N (4S°) atom generated by an Ar plasma source [Citation144] (Modified from J Phys D 50, 195202 (2017)).](/cms/asset/9bef5ddd-432c-4c99-a3aa-1915cdd5759f/ifra_a_2230351_f0009_c.jpg)
Figure 10. (a) Schematic and (b) image of the atmospheric pressure jet (APPJ) (plasma plume was visible during operation) [Citation155] (Reprinted from J Phys D 52, 075203 (2019)).
![Figure 10. (a) Schematic and (b) image of the atmospheric pressure jet (APPJ) (plasma plume was visible during operation) [Citation155] (Reprinted from J Phys D 52, 075203 (2019)).](/cms/asset/5de48cc0-6ec2-48f1-966f-290d238fad04/ifra_a_2230351_f0010_c.jpg)
Figure 11. APPJ strikes at center top and streamline images 2 min into treatment at 5 mm nozzle elevation for (a) 2 slm helium, (b) 2 slm plasma at 8 kVpp, (c) 4 slm helium, and (d) 4 slm plasma at 8 kVpp (plasma discharge increased the liquid velocity and size of the circulation flow) [Citation155] (Reprinted from J Phys D 52, 075203 (2019)).
![Figure 11. APPJ strikes at center top and streamline images 2 min into treatment at 5 mm nozzle elevation for (a) 2 slm helium, (b) 2 slm plasma at 8 kVpp, (c) 4 slm helium, and (d) 4 slm plasma at 8 kVpp (plasma discharge increased the liquid velocity and size of the circulation flow) [Citation155] (Reprinted from J Phys D 52, 075203 (2019)).](/cms/asset/20919d12-c34a-413f-89ec-c26846d2d5dd/ifra_a_2230351_f0011_c.jpg)
Figure 12. Streamlines of pH changes measured using a BTB solution [after treatment over 5 min at 8 kVpp and 2 slm, acidity appears at the impingement point (t = 10 s), and acidified liquid is largely contained within the circulation flow; in the absence of jet-driven circulation flow, acidic liquid diffuses throughout the vessel after an initial downward flow caused by liquid inertia (t = 6 min)] [Citation155] (Reprinted from J Phys D 52, 075203 (2019)).
![Figure 12. Streamlines of pH changes measured using a BTB solution [after treatment over 5 min at 8 kVpp and 2 slm, acidity appears at the impingement point (t = 10 s), and acidified liquid is largely contained within the circulation flow; in the absence of jet-driven circulation flow, acidic liquid diffuses throughout the vessel after an initial downward flow caused by liquid inertia (t = 6 min)] [Citation155] (Reprinted from J Phys D 52, 075203 (2019)).](/cms/asset/de91668f-5831-498a-8024-a51d4ead01f1/ifra_a_2230351_f0012_c.jpg)
Figure 13. Schematic of reaction pathways in the plasma plume, gas phase, surface, and the bulk liquid [feed (blue), precursor (black), and antitumor (red) species] [Citation158] (Reprinted from J Phys D 50, 155202 (2017)).
![Figure 13. Schematic of reaction pathways in the plasma plume, gas phase, surface, and the bulk liquid [feed (blue), precursor (black), and antitumor (red) species] [Citation158] (Reprinted from J Phys D 50, 155202 (2017)).](/cms/asset/02eec0c0-bc17-4f55-b8f5-b063cd2df3a4/ifra_a_2230351_f0013_c.jpg)
Figure 14. Reaction schemes of (a) methanol, (b) ethanol, and (c) 1-propanol (chemical reactions suggested that hydrogen abstraction was indirectly dominant) [Citation159] (Reprinted from J Phys D 51, 095202 (2018)).
![Figure 14. Reaction schemes of (a) methanol, (b) ethanol, and (c) 1-propanol (chemical reactions suggested that hydrogen abstraction was indirectly dominant) [Citation159] (Reprinted from J Phys D 51, 095202 (2018)).](/cms/asset/a0124303-07fb-4708-aed2-c74de75a8921/ifra_a_2230351_f0014_c.jpg)
Figure 15. (Left) Schematic of the interaction of solar wind with earth’s atmosphere, (right) concept model of plasma-activated organics generated in culture medium fluids; rich RONS and hydroxyl radicals mediate the aqueous chemistry; PAM produced under hyperoxia in ambient conditions has potent cytotoxicity anticipated by plasma-activated organics.
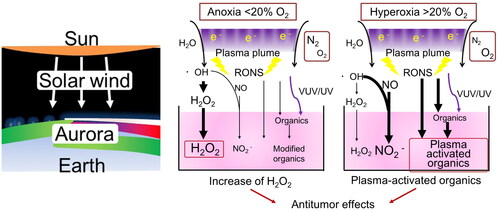
Figure 16. Development timeline of representative diagnostics for plasma–liquid and plasma-biological interactions. LTS: laser Thomson scattering for electron density and temperature measurements; ESR: electron spin resonance. Jia 2011 [Citation165], Ishikawa 2012 [Citation166], Takeda 2013 [Citation167], Jia 2014 [Citation168], Takeda 2017 [Citation144], Takeda 2019 [Citation143], Brubaker 2017 [Citation154], Brubaker 2019 [Citation155], Tanaka [Citation161], Liu [Citation163], Uchiyama [Citation159], Kurake 2016, 2017 [Citation158,Citation169], Kurake 2019 [Citation170], and Ishikawa 2020 [Citation171].
![Figure 16. Development timeline of representative diagnostics for plasma–liquid and plasma-biological interactions. LTS: laser Thomson scattering for electron density and temperature measurements; ESR: electron spin resonance. Jia 2011 [Citation165], Ishikawa 2012 [Citation166], Takeda 2013 [Citation167], Jia 2014 [Citation168], Takeda 2017 [Citation144], Takeda 2019 [Citation143], Brubaker 2017 [Citation154], Brubaker 2019 [Citation155], Tanaka [Citation161], Liu [Citation163], Uchiyama [Citation159], Kurake 2016, 2017 [Citation158,Citation169], Kurake 2019 [Citation170], and Ishikawa 2020 [Citation171].](/cms/asset/ee79859a-8504-4f59-8741-c227044fdd04/ifra_a_2230351_f0016_c.jpg)
Figure 17. Development timeline of plasma cancer therapy. FE-DBD: floating electrode dielectric barrier discharge; NEAPP: non-equilibrium atmospheric pressure plasma; LF-jet: low frequency operated plasma jet; PAM: plasma activated medium; PAL: plasma-activated ringer’s lactated solution; EBM: evidence-based medicine; ICPM: international conference on plasma medicine; IWPCT: international workshop on plasma cancer therapy. Akiyama [Citation174], Stoffels [Citation101], Kieft [Citation175], Fridman [Citation176], Kalghatgi [Citation102], Isbary [Citation103], von Woedtke [Citation104], Kaushik [Citation177], Vandamme [Citation178], Lukes [Citation179], Miller [Citation180], Metelmann [Citation181], Sato [Citation182], Iwasaki [Citation12], Iseki [Citation85], Ikehara [Citation106], Tanaka 2013 [Citation86,Citation87], Kurake 2016 [Citation169], Tanaka 2017 [Citation183], Kurake 2019 [Citation170], and Jiang [Citation184].
![Figure 17. Development timeline of plasma cancer therapy. FE-DBD: floating electrode dielectric barrier discharge; NEAPP: non-equilibrium atmospheric pressure plasma; LF-jet: low frequency operated plasma jet; PAM: plasma activated medium; PAL: plasma-activated ringer’s lactated solution; EBM: evidence-based medicine; ICPM: international conference on plasma medicine; IWPCT: international workshop on plasma cancer therapy. Akiyama [Citation174], Stoffels [Citation101], Kieft [Citation175], Fridman [Citation176], Kalghatgi [Citation102], Isbary [Citation103], von Woedtke [Citation104], Kaushik [Citation177], Vandamme [Citation178], Lukes [Citation179], Miller [Citation180], Metelmann [Citation181], Sato [Citation182], Iwasaki [Citation12], Iseki [Citation85], Ikehara [Citation106], Tanaka 2013 [Citation86,Citation87], Kurake 2016 [Citation169], Tanaka 2017 [Citation183], Kurake 2019 [Citation170], and Jiang [Citation184].](/cms/asset/193baae6-e869-419e-b2c8-2dffac6c2dd7/ifra_a_2230351_f0017_c.jpg)
Figure 18. Intracellular molecular mechanisms to explain the differences between PAM- and PAL-treated glioblastoma cells; models of intracellular molecular mechanisms of cell death in (a) PAM-treated and (b) PAL-treated glioblastoma cells, based on microarray and qRT-PCR [Citation185] (Reprinted from Sci Rep 9, 13657 (2019)).
![Figure 18. Intracellular molecular mechanisms to explain the differences between PAM- and PAL-treated glioblastoma cells; models of intracellular molecular mechanisms of cell death in (a) PAM-treated and (b) PAL-treated glioblastoma cells, based on microarray and qRT-PCR [Citation185] (Reprinted from Sci Rep 9, 13657 (2019)).](/cms/asset/7103f00a-5270-4517-b742-50ba8b55690e/ifra_a_2230351_f0018_b.jpg)
Figure 19. Model of NAD-enzymatic deactivation of PAM treated cells. NMNAT enzyme deactivated and accumulated PRPP. ATP and NAD+ synthesis downregulated and a key GAPDH enzyme deactivated. Metabolism in down-flow from G3P to BPG in glycolysis was deactivated with intermediate accumulation [Citation170] NAM: nicotinamide; NAMPT: nicotinamide phosphoribosyltransferase; NMN: nicotinamide mononucleotide; NMNAT: nicotinamide mononucleotide adenylyltransferease; G3P: glyceraldehyde 3-phosphate; BGP: 1,3-bisphosphoglycerate. (Reprinted from Arch Biochem Biophys 662, 83 (2019).).
![Figure 19. Model of NAD-enzymatic deactivation of PAM treated cells. NMNAT enzyme deactivated and accumulated PRPP. ATP and NAD+ synthesis downregulated and a key GAPDH enzyme deactivated. Metabolism in down-flow from G3P to BPG in glycolysis was deactivated with intermediate accumulation [Citation170] NAM: nicotinamide; NAMPT: nicotinamide phosphoribosyltransferase; NMN: nicotinamide mononucleotide; NMNAT: nicotinamide mononucleotide adenylyltransferease; G3P: glyceraldehyde 3-phosphate; BGP: 1,3-bisphosphoglycerate. (Reprinted from Arch Biochem Biophys 662, 83 (2019).).](/cms/asset/d000a8d0-433f-4896-8593-12d540b12a39/ifra_a_2230351_f0019_c.jpg)
Figure 20. Model summarizing metabolomic changes in PAL-treated cells in comparison with the previous study on PAM [Citation171] (Reprinted from Arch Biochem Biophys 688, 108414 (2020)).
![Figure 20. Model summarizing metabolomic changes in PAL-treated cells in comparison with the previous study on PAM [Citation171] (Reprinted from Arch Biochem Biophys 688, 108414 (2020)).](/cms/asset/9fd43255-2fe2-4c6a-82f3-623d0ec05d94/ifra_a_2230351_f0020_c.jpg)
Figure 21. Inhibition of glycolysis and tricarboxylic acid (TCA) cycle in HeLa cells by plasma-activated ringer’s lactate solution (PAL); extracellular H2O2 induces intracellular H2O2 by penetrating through aquaporins, subsequently inducing apoptosis in HeLa cells; non-H2O2 PAL components in PAL (PAL2w) induce intracellular ROS (but not H2O2), which are responsible for impairment of mitochondrial respiratory system, glycolysis, and TCA cycle, ultimately inducing non-apoptotic cell death in HeLa cells (arrowheads represent stimulatory relationships and blunt arrowheads represent inhibitory relationships) [Citation187]. (Reprinted from Plasma Process Polym 18, 2100056 (2021)).
![Figure 21. Inhibition of glycolysis and tricarboxylic acid (TCA) cycle in HeLa cells by plasma-activated ringer’s lactate solution (PAL); extracellular H2O2 induces intracellular H2O2 by penetrating through aquaporins, subsequently inducing apoptosis in HeLa cells; non-H2O2 PAL components in PAL (PAL2w) induce intracellular ROS (but not H2O2), which are responsible for impairment of mitochondrial respiratory system, glycolysis, and TCA cycle, ultimately inducing non-apoptotic cell death in HeLa cells (arrowheads represent stimulatory relationships and blunt arrowheads represent inhibitory relationships) [Citation187]. (Reprinted from Plasma Process Polym 18, 2100056 (2021)).](/cms/asset/0cd79c8e-2508-44a3-b14f-8081b7ed896b/ifra_a_2230351_f0021_c.jpg)
Figure 22. Model of PAL-induced ferroptosis in malignant mesothelioma (MM) cells, with exogenous NO as a component of PAL; initially, NO activates transcription factor NF-κB in MM cells, upregulating the downstream iNOS; then, NO accumulates in lysosomes, starting autophagic process; eventually, lysosomal lipid peroxidation is exceeded over the threshold and leads to lysosomal membrane permeabilization (LMP); this entire process eventually leads to ferroptosis [Citation184] (Reprinted from Redox Biol 43, 101989 (2021)).
![Figure 22. Model of PAL-induced ferroptosis in malignant mesothelioma (MM) cells, with exogenous NO as a component of PAL; initially, NO activates transcription factor NF-κB in MM cells, upregulating the downstream iNOS; then, NO accumulates in lysosomes, starting autophagic process; eventually, lysosomal lipid peroxidation is exceeded over the threshold and leads to lysosomal membrane permeabilization (LMP); this entire process eventually leads to ferroptosis [Citation184] (Reprinted from Redox Biol 43, 101989 (2021)).](/cms/asset/212b2c76-d567-4b54-b342-b5912ab03cab/ifra_a_2230351_f0022_c.jpg)
Table 1. Brief summary of reports on direct and indirect plasma irradiations.
Table 2. Categories of typical mechanisms of regulated cell death [Citation263].
Figure 23. (a) Conventional model of plasma effects via linear cascade reaction responses, (b) present status of modeling of plasma-induced effects via wide-spreading synergisms on multiple reactions pathways, and (c) future goal of modeling via complicated reaction network with communication between clusters of bacteria, organelle, cells, etc. [Citation14] (Reprinted from Jpn J Appl Phys 61, SA0805 (2022)).
![Figure 23. (a) Conventional model of plasma effects via linear cascade reaction responses, (b) present status of modeling of plasma-induced effects via wide-spreading synergisms on multiple reactions pathways, and (c) future goal of modeling via complicated reaction network with communication between clusters of bacteria, organelle, cells, etc. [Citation14] (Reprinted from Jpn J Appl Phys 61, SA0805 (2022)).](/cms/asset/a7592077-21cc-4a19-adee-eafe455b61e9/ifra_a_2230351_f0023_c.jpg)