Figures & data
Figure 1. Screening of PCBP2-interacting proteins with mitochondrial lysates of KU812 leukemia cells with erythroid differentiation identifies SFXN3 and TOM20. (A) Silver staining after SDS-PAGE for LC-MS/MS identification of PCBP2-interacting mitochondrial proteins in KU812 cells. Arrow heads indicate specific bands detected in GST-PCBP2/mitochondrial lysate mixtures. Refer to text, and Table S2 for the identified proteins. (B) Mitochondrial fractions of HeLa cells were digested with 1, 2, 5 µg/mL Proteinase K. Proteins were detected by immunoblotting with mouse anti-PCBP2 mAb, rabbit anti-SFXN3 pAb, rabbit anti-TOM20 pAb and rabbit anti-COX4 pAb. (C-L) FLAG-SFXN3 expressing HeLa cells were co-stained with mouse anti-FLAG mAb/rabbit anti-COX4 pAb (C, D, E), mouse anti-FLAG mAb/rabbit anti-TOM20 pAb (F, G), mouse anti-FLAG mAb/mouse anti-PCBP2 mAb (H, I, J) and mouse anti-TOM70/mouse anti-PCBP2 mAb (K, L). Dashed lines in D, F, I and K show the analyzed plots of the fluorescence intensity profiles in E, G, J and L, respectively. Scale bars in C and H, 10 µm; scale bars in D, F, I and K, 1 µm.
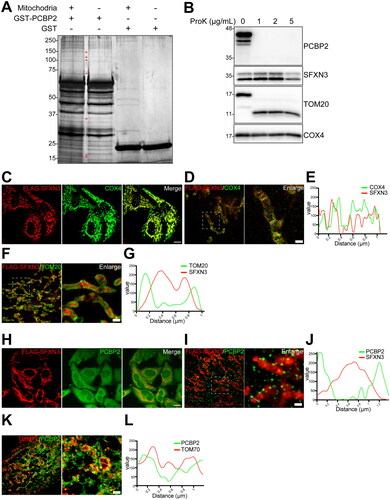
Table 1. Final nine candidates as a mitochondrial receptor for cytosolic PCBP2.
Figure 2. Analysis of molecular interactions of PCBP2 and mitochondrial molecules. (A) Molecular interaction between PCBP2/TOM20 (left) or PCBP2/COX4 (right) was analyzed by PLA in HeLa cells. (B) Hela cells were stained with MitoTracker and PCBP2/TOM20 interaction was analyzed by PLA. (C) Molecular interaction between FLAG-SFXN3/TOM20 was analyzed by PLA in FLAG (empty vector) (left) or in FLAG-SFXN3 stably expressing HeLa cells (right). (D) FLAG-SFXN3 stably expressing HeLa cells were stained with MitoTracker and PCBP2/TOM20 interaction was analyzed by PLA. Scale bars in A, B, C (Merge) and D (Merge), 10 µm; scale bars in B (Enlarge) and D (Enlarge), 1 µm. PLA, proximity ligation assay. (E) Molecular interaction between FLAG-SFXN3/TOM20 was analyzed by co-immunoprecipitation assay. Crude mitochondrial fractions were obtained from FLAG (empty vector) (left) or FLAG-SFXN3 stably expressing HeLa cells. Protein (5 μg) from mitochodrial lysates was applied to the gel and analyzed by immunoblotting using anti-SFXN3 pAb or anti-TOM20 mAb (input). Protein (300 μg) from each lysate of FLAG, or FLAG-SFXN3 was co-immunoprecipitated with anti-FLAG mAb-conjugated protein G beads and analyzed by immunoblotting using an anti-FLAG mAb or anti-TOM20 mAb.
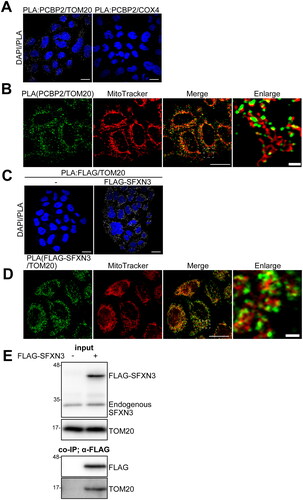
Figure 3. SFXN3 and/or PCBP2 knockdown decreases intracellular and mitochondrial catalytic Fe(II) and mitochondrial maximum respiration in K562 leukemia cells. (A) K562 cells were transfected with negative control siRNA, SFXN3 siRNAs and/or PCBP2 siRNA, and the effects were evaluated after 48 h with immunoblot analysis. (B–E) Intracellular catalytic Fe(II) (B), mitochondrial catalytic Fe(II) (C), free heme (D), and hemoglobin (E) were measured by FerroOrange, Mito-FeroGreen, H-FluNox and hemoglobin assay kit, respectively. Each data was normalized by control condition. Error bars represent SD from three independent experiments. (means ± SD; n.s., not significant; *, p < .05; **, p < .01; ***, p < .001; ****, p < .0001). (F, G) Mitochondrial respiration assay was performed in K562 cells depleted SFXN3 and/or PCBP2 by Seahorse XFe24 Analyzer. Error bars represent SD from six independent experiments. (means ± SD; **, p < .01).
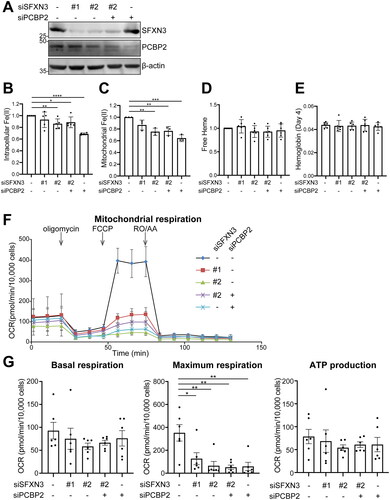
Figure 4. Knockout study in MEF cells reveals that iron entry to mitochondria by SFXN3 is distinct from the role of MFRN1. (A) SgControl-MEF, MFRN1 KO-MEF, and SFXN3-KO-MEF were treated with 20 µg/mL FAC for 0, 6 and 12 h and protein expression was analyzed by immunoblotting. FTL (long) indicates a longer exposed version of FTL. (B) Quantitative analysis of the data shown in (A). p values were generated using a one-sample t-test. Error bars represent SD from three independent experiments. (means ± SD; *p < .05; **p < .01; ***p < .001; ****p < .0001). (C) MEF cells were treated with 20 µg/mL Alexa568 conjugated holo-Tf in DMEM w/o FBS for the indicated time. Cells were washed with cold PBS and fixed with 4% PFA/PBS. At least five images were obtained by FV1000 microscopy. (D) Quantitation of data shown in (C). Error bars represent SD from three independent experiments. (means ± SD; *p < .05; **p < .01). (E) Cells were treated with 20 µg/mL FAC for 0, 6 h and mitochondrial Fe(II) was measured by Mito-FerroGreen. Representative images from 6 h-FAC treatment were shown in E. (F) Quantitation of data shown in (E). Error bars represent SD from three independent experiments. (means ± SD; *p < .05; **p < .01; ****p < .0001). MEF, mouse embryonic fibroblast; FAC, ferric ammonium citrate. (G) MEF cells were treated with 50 µg/mL FAC or 50 µg/mL FAC/5 µM SnMP for 12 h and heme was measured with heme probe. (H) Quantitation of data shown in (G). Mean green fluorescence intensity of fifty cells from >5 different fields was quantified using Fiji. (means ± SD; *p < 005; **p < .01; ***p < .001).
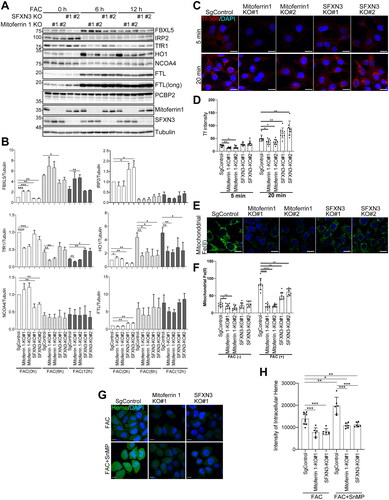
Figure 5. SFXN3 overexpression overcomes iron excess to load Fe(II) to mitochondria but induces ferroptosis sensitivity by RSL3. (A) HeLa or FLAG-SFXN3 stably expressing HeLa cells were treated with 20 µg/mL FAC for 0 or 6 h and protein expression was analyzed by immunoblotting. (B) Quantitative analysis of the data shown in (A). p values were generated using a one-sample t-test. Error bars represent SD from three independent experiments. (means ± SD; *p < .05; **p < .01; ****p < .0001). (C) FLAG-SFXN3 stably expressing HeLa cells were treated with 20 µg/mL FAC for 0, 6 h and mitochondrial Fe(II) was measured by Mito-FerroGreen. Representative images from 6 h-FAC treatment were shown in A. (D) Quantitation of data shown in (C). Error bars represent SD from three independent experiments. (means ± SD; **p < .01; ****p < .0001). (E) Cells were treated with 0.25 µM RSL3 for 0, 2, 4 or 6 h. Dead cells were stained with trypan blue. Representative images from 0 and 4 h-RSL3 treatment were shown in C. (F) Quantitation of data shown in C. Error bars represent SD from three independent experiments. (means ± SD; *p < .05; ***p < .001).
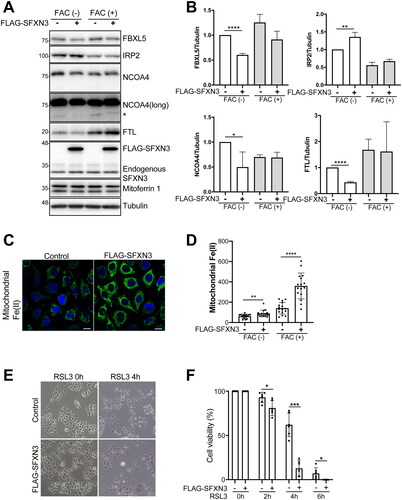
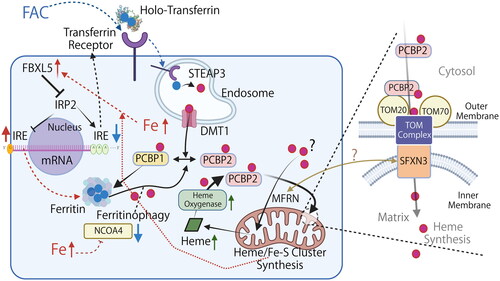
Figure 6. Working model of cytosolic Fe(II) delivery to mitochondria via iron chaperone in the context of iron overload. Graphical representation of the working model in which cytosolic PCBP2 delivers Fe(II) to mitochondria. PCBP2 binds to TOM20 on the mitochondrial outer membrane and delivers Fe(II). SFXN3 is localized on the mitochondrial inner membrane and interacts with the TOM complex to transport Fe(II) into the matrix. Filled red circle, Fe(II); filled blue circle, Fe(III); DMT1, divalent metal transporter 1 (also as SLC11A2); FAC, Fe(III) ammonium citrate; FBXL5, F-box/LRR-repeat protein 5; FTL, ferritin light chain; IRE, iron-responsive element; IRP2, iron regulatory protein 2; NCOA4, nuclear receptor coactivator 4; STEAP3, six-transmembrane epithelial antigen of prostate 3. Note that only major pathways associated with this study is described and the diagram is simplified. Time course is also important for each reaction/signaling. The association of MFRN and SFXN3 is unelucidated. Refer to text for details.