Figures & data
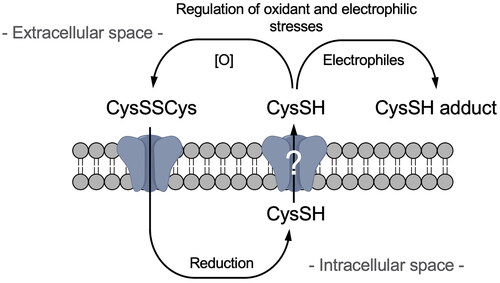
Figure 1. Intracellular and extracellular cysteine (CysSH) content after exposure to stable isotope-labeled cystine and the consumption of extracellular cysteine by hydrogen peroxide or electrophiles in HepG2 cells. (A) Intracellular CysSH content. Cells were exposed to stable isotope-labeled cystine (100 µM) in Hank’s balanced salt solution (HBSS) for 0.5 or 1 h, and the cells were collected with methanol containing 1 mM β-(4-hydroxyphenyl)ethyl iodoacetamide (HPE-IAM), followed by liquid chromatography-ESI-tandem mass spectrometry (LC-ESI-MS/MS) analysis as described in the Methods section. (B) Extracellular CysSH content. Cells were exposed to stable isotope-labeled cystine (100 µM) in HBSS for 0.5 or 1 h, and the conditioned medium was collected and reacted with 5 mM HPE-IAM for 30 min at 37 °C, followed by LC-ESI-MS/MS analysis described in the Methods section. (C) Cells were exposed to stable isotope-labeled cystine (100 µM) in HBSS for 1 h, and the conditioned medium was collected and reacted with 5 mM HPE-IAM for 30 min at 37 °C after incubation with 50 µM of H2O2, 1,2-naphthoquinone (1,2-NQ), 1,4-NQ or 1,4-benzoquinone (1,4-BQ) for 1 h at 37 °C, followed by LC-ESI-MS/MS analysis as described in the Methods section. **p < 0.01 compared with control.
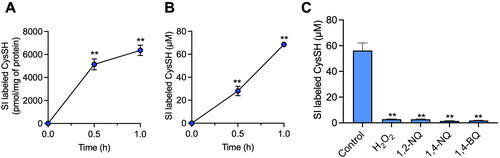
Figure 2. Alteration of extracellular cysteine (CysSH) content after exposure to stable isotope-labeled cystine in HepG2 cells. (A). Cells were pre-incubated with stable isotope-labeled cystine (100 µM) in Hank’s balanced salt solution (HBSS) for 1 h and then exposed to H2O2 (50 or 100 µM) for 0.5, 1 or 2 h. (B). Cells were pre-incubated with stable isotope-labeled cystine (100 µM) in HBSS for 1 h and then exposed to 1,2-naphthoquinone (1,2-NQ, 50 or 100 µM) for 0.5, 1 or 2 h. (C). Cells were pre-incubated with stable isotope-labeled cystine (100 µM) in HBSS for 1 h and then exposed to 1,4-NQ (50 or 100 µM) for 0.5, 1 or 2 h. (D). Cells were pre-incubated with stable isotope-labeled cystine (100 µM) in HBSS for 1 h and then exposed to 1,4-benzoquinone (1,4-BQ, 50 or 100 µM) for 0.5, 1 or 2 h. The conditioned medium was collected and reacted with 5 mM β-(4-hydroxyphenyl)ethyl iodoacetamide for 30 min at 37 °C, followed by liquid chromatography-ESI-tandem mass spectrometry analysis as described in the Methods section. **p < 0.01 compared with control.
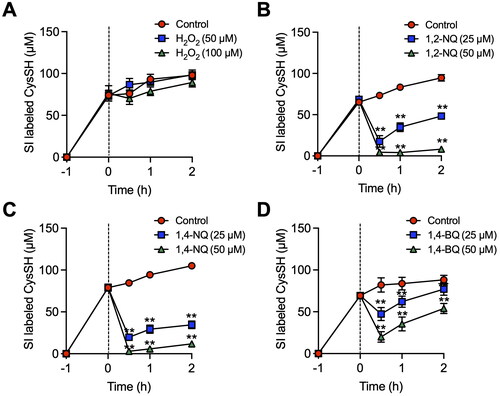
Figure 3. Effect of extracellular cysteine derived from cystine on oxidative and covalent modifications of cellular proteins in HepG2 cells. (A) Cells were pre-incubated with stable isotope-labeled cystine (100 µM) in Hank’s balanced salt solution for 1 h and then added with or without H2O2 (100 µM) for 1 h. Total cell lysates were prepared with RIPA buffer with or without 1 mM biotin-conjugated dimedone derivative (DCP-Bio1), and subjected to western blot analysis using streptavidin-HRP or SDS-PAGE with Coomassie brilliant blue (CBB) staining. The bar graph represents quantitative results of the upper bands of western blots. Each value represents the mean ± SE of three independent experiments. **p < 0.01 compared with no changing of medium with H2O2 exposure. (B) Cells were pre-incubated with stable isotope-labeled cystine (100 µM) in Hank’s balanced salt solution for 1 h and then incubated with 1,2-naphthoquinone (1,2-NQ, 50 µM) for 1 h. Total cell lysates prepared with RIPA buffer were subjected to western blot analysis using an antibody against 1.2-NQ, or SDS-PAGE with CBB staining. The bar graph represents quantitative results of the upper bands of western blots. Each value represents the mean ± SE of three independent experiments. **p < 0.01 compared with control.
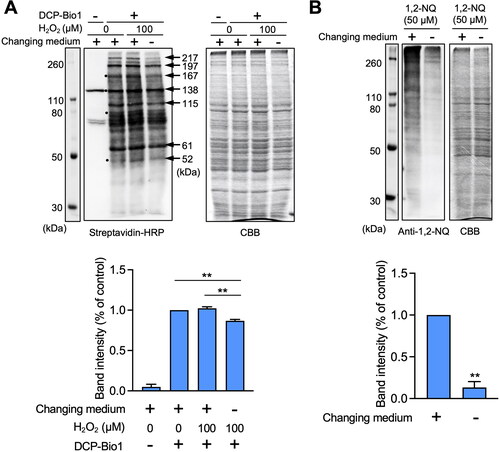
Figure 4. Contribution of enzymes and low molecular chemicals to the reduction of cystine to cysteine (CysSH) in vitro. (A) CysSH production from cystine. High molecular weight fraction (HMWF) prepared from HepG2 cells (0.4 mg/mL) was incubated with stable isotope-labeled cystine (100 µM), with or without the indicated antioxidants (each 100 µM) or heat treatment for 10 min at 37 °C. The resulting solution was incubated with 5 mM β-(4-hydroxyphenyl)ethyl iodoacetamide (HPE-IAM) for 30 min at 37 °C, followed by liquid chromatography-ESI-tandem mass spectrometry analysis as described in the Methods section. (B) Effect of heat on production of CysSH from cystine by the low molecular weight fraction (LMWF). The LMWF prepared from HepG2 cells with or without heat treatment (95 °C for 10 min) was incubated with stable isotope-labeled cystine (100 µM). The resulting solution was incubated with 5 mM HPE-IAM for 30 min at 37 °C, followed by liquid chromatography-ESI-tandem mass spectrometry analysis as described in the Methods section. **p < 0.01 compared with control. CoQ10; coenzyme Q10, DHLA; dihydrolipoic acid, GSH; glutathione, NADPH; β-nicotinamide-adenine dinucleotide phosphate.
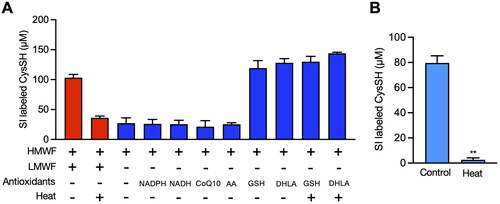
Figure 5. Effect of knockdown of thioredoxin (Trx), Trx-related protein 14 (TRP14) and TRP32 on the production of cysteine (CysSH) from cystine in HepG2 cells. (A) Knockdown of Trx, TRP14 and TRP32. Cells were transfected with control, Trx, TRP14 and TRP32 siRNAs for 48 h, and then total cell lysates were subjected to western blot analysis with the indicated antibodies. (B) Intracellular CysSH content after exposure to stable isotope-labeled cystine. Control siRNA-, Trx siRNA-, TRP14 siRNA- and TRP32 siRNA-transfected cells (48 h) were exposed to stable isotope-labeled cystine (100 µM) in Hank’s balanced salt solution for 0.5, 1 or 2 h, and then cells were collected with methanol containing 1 mM β-(4-hydroxyphenyl)ethyl iodoacetamide (HPE-IAM), followed by liquid chromatography-ESI-tandem mass spectrometry analysis as described in the Methods section. (C) Extracellular CysSH content after exposure to stable isotope-labeled cystine. Control siRNA-, Trx siRNA-, TRP14 siRNA- and TRP32 siRNA-transfected cells (48 h) were exposed to stable isotope-labeled cystine (100 µM) in Hank’s balanced salt solution for 0.5, 1 or 2 h, and the conditioned medium was collected and reacted with 5 mM HPE-IAM for 30 min at 37 °C, followed by liquid chromatography-ESI-tandem mass spectrometry analysis described in the Methods section.
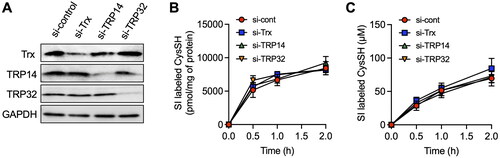
Table 1. Chemical conversion of cystine to cysteine (CysSH) by glutathione (GSH) or dihydrolipoic acid (DHLA).
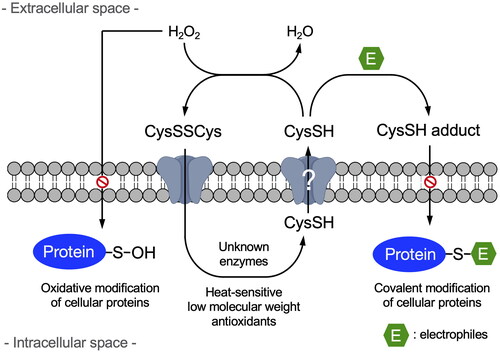
Figure 6. Scheme for the negative regulation of oxidative and electrophilic stress by extracellular cysteine.