Figures & data
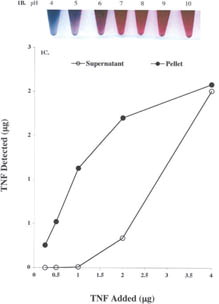
1 (a) Transmission electron microscopy of the colloidal gold nanoparticles. Colloidal gold nanoparticles were manufactured as described in the Materials and Methods. After filtration 10 ml of the sol was centrifuged at 2500rpms for 2 hr. The colloidal gold pellet was analyzed by TEM using standard techniques. Bar = 33 nm. (b) Determination of the pH binding optimum of TNF to the colloidal gold nanoparticles. To determine the pH for binding TNF to the colloidal gold particles, the pH of 2 ml aliquots of 34 nm colloidal gold sol was adjusted, as measured on pH strips, from pH 5 to 11 using 1N NaOH. TNF (Knoll Pharmaceuticals; provided by the Surgery Branch, NCI; repurified to homogeneity) was reconstituted in DIH2O to a concentration of 1 mg/ml and further diluted to 100 μg/ml in 3 mM TRIS base pH 8. One hundred microliters of this TNF stock was added to the seven aliquots of pH-adjusted colloidal gold and incubated for 15min. Following this incubation, 100 μl of a 10% NaCl solution was added to each of the aliquots to induce particle precipitation. The optimal binding pH was defined as the pH that allowed TNF to bind to the colloidal gold particles while preventing the particles' precipitation by salt (Red arrows). (c) Saturation binding of TNF to the colloidal gold nanoparticles. The pH of the 33 nm colloidal gold sol was adjusted to pH 8 with 1 N NaOH. The sol was divided into 1 ml aliquots to which increasing amounts of TNF were added. After binding for 15 min the samples were centrifuged at 7,500 rpm for 15 min, and the resultant colloidal gold pellets and supernatants were analyzed by a quantitative EIA.
Characteristics of the colloidal gold TNF vector: Colloidal gold particle size characterization
Characteristics of the colloidal gold TNF vector: Mechanism of TNF binding to colloidal gold nanoparticles
Characteristics of the colloidal gold TNF vector: Analysis of zeta potential during different stages of PT-cAu-TNF vector manufacture
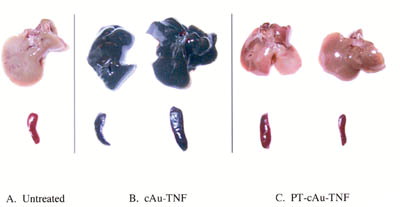
2 Hepatic and splenic uptake of the cAu-TNF formulation and the PEG-THIOL cAu-TNF formulation (PT-cAu-TNF) compared to an untreated mouse. Two MC-38 tumor-burdened C57/BL6 mice were injected intravenously with the cAu-TNF vector, and another two tumor-burdened C57/BL6 mice were injected with the PT-cAu-TNF formulation. An untreated mouse and the four treated mice were sacrificed 5 hr after injection of 15 μg of the two different cAu formulations, and all five animals were perfused with heparinized saline. The livers and spleens from these animals were collected and photographed using a digitial camera. (a) Liver and spleen from an untreated mouse. (b) Livers and spleens from mice receiving the cAu-TNF vector. (c) Liver and spleen from mice receiving the PT-cAu-TNF vector.
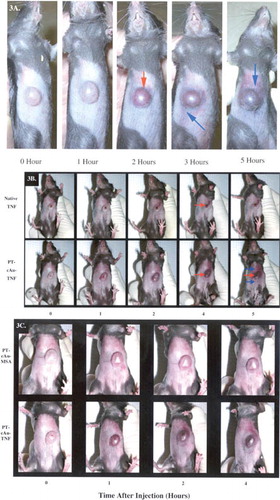
3 (a) Accumulation of the PT-cAu-TNF vector in MC-38 tumors over time. A MC-38 tumor-burdened C57/BL6 mouse was intravenously injected with 15 μg of the PT-cAu-TNF vector. The ventral surface of the animal was photographed at the indicated times, showing the color changes of the tumor over 5 hr. Red arrows show tumor uptake of the vector; blue arrows show accumulation of the vector in the tissues surrounding the tumor. (b) Comparative accumulation of the native TNF and PT-cAu-TNF vectors in MC-38 tumors. Fifteen micrograms of the native TNF and the PT-cAu-TNF vectors were intravenously injected into MC-38 tumor-burdened C57/BL6 mice. At specific time points the MC-38 tumors in these mice were photographed to document the vectors' accumulation. Tumor staining indicated by red arrows, and extratumor staining indicated by blue arrows. (c) Accumulation of a PEG-THIOL–stabilized colloidal gold-MSA vector and the PT-cAu-TNF vector in MC-38 tumors. Fifteen micrograms of the PT-cAu-TNF vector and an equal volume of the PT-cAu-MSA vector were intravenously injected into MC-38 tumor burdened mice. A wavelength scan of each preparation verified that the preparations had identical colloidal gold particle concentrations. The time course of each vector's accumulation in MC-38 tumors was photographed.
4 (a) The pharmacokinetic profiles of native TNF and the cAu-TNF vector in MC-38 tumor-burdened C57/BL6 mice. MC-38 tumor-burdened mice (n = 3/group/time point) were intravenously injected with 10 μg of either native TNF or the cAu-TNF vector. At the indicated time points the mice were anesthetized and bled through the retro-orbital sinus, and the blood was diluted 1:1 with PBS containing 1 mg/ml heparin. TNF concentrations were determined using an EIA. Data are presented as the mean ± SEM blood concentration from three mice per time point.*ast; p < 0.05 cAu-TNF versus native. (b) The pharmacokinetic profiles of native TNF and the PT-cAu-TNF vector in MC-38 tumor-burdened C57/BL6 mice. Mice were bled through the retro-orbital sinus at 5, 180, and 360 min after the injection, and the blood samples were analyzed as described above. Data are presented as the mean ± SEM blood TNF concentration from 3 mice/time point. Δ p < 0.1 * p < 0.05 versus native group.
5 (a) Intratumor TNF accumulation following an intravenous injection of the PT-cAu-TNF. Mice were sacrificed 5, 180, and 360 min after the injection of 15 μg of native TNF or PT-cAu-TNF. The tumors were removed, homogenized, and analyzed for TNF concentrations and total protein as described in the Material and Methods section. Data are presented as the mean ± SEM of tumor TNF concentration, expressed in ng TNF/mg of total protein, from 3 mice/time point/treatment group. *p < 0.05 versus native; p < 0.05 versus 5 min time point for PT-cAu-TNF treatment. Time-to-time comparison NS for native. Organ TNF distribution analysis from MC-38 tumor-burdened C57/BL6 mice receiving either (b) PT-cAu-TNF or (c) native TNF. Livers, lung and brains from the animals were processed and analyzed for TNF and protein concentrations as described in the Material and Methods section. Data are presented as the mean ± SEM of intraorgan TNF concentration from 3 mice/time point/formulation injected.
6 (a) Comparison of the antitumor efficacy of native TNF and the cAu-TNF vector in MC-38 tumor-burdened C57/BL6 mice. MC-38–tumored C57/BL6 mice (n = 4/group/dose) were intravenously injected with increasing doses of native TNF or the cAu-TNF vector. The antitumor responses for the various treatment groups were measured by determining three dimensional (L × W × H) tumor measurements 10 days after treatment. Data are presented as the mean ± SEM tumor volume (in cm3) for each group. †All animals receiving the 24 μg native TNF treatment died within 24 hr of treatment. *p ≤ 0.05 versus untreated controls (b) Antitumor efficacy of native TNF and the PT-cAu-TNF vector: effect of PEG-THIOL on antitumor efficacy. MC-38 tumor-burdened C57/BL6 mice were divided into 9 groups with 9 animals/group. One group served as an untreated control group. Two groups were intravenously injected with either 7.5 or 15 μg of native TNF. Two groups were also intravenously injected with either 7.5 or 15 μg of the PT-cAu-TNF vector. Tumor measurements were made on various days after the treatment on animals that survived TNF treatment. Statistical difference between the various groups was determined using a paired t-test. †, p < 0.05 for the 7.5 μg of dose of native TNF versus untreated controls.§, p < 0.05 for the 7.5 μg of dose of the PT-cAu-TNF treatment versus untreated controls and native TNF groups. *, p < 0.05 for the 15 μg of dose of native or both PT-cAu-TNF treatments versus untreated controls and the 7.5 μg of dose native TNF. The 7.5 μg of the PT-cAu-TNF vector was not statistically different from the 15 μg of either native TNF or PT-cAu-TNF treatments.