1,166
Views
55
CrossRef citations to date
0
Altmetric
Research Article

Synthesis, Characterization and Evaluation of IPN Hydrogels for Antibiotic Release

&
Pages 381-388 | Published online: 19 Oct 2008

Figures & data

1 FT-IR spectra of the samples: ···. = C, –.–.– = C-P, — = C-P-A/0.5.

1 FT-IR spectra of the samples: ···. = C, –.–.– = C-P, — = C-P-A/0.5.

2 TG thermograms of the samples: ···. = C, –.–.– = C-P, — = C-P-A/0.5.

2 TG thermograms of the samples: ···. = C, –.–.– = C-P, — = C-P-A/0.5.

3 Thermal degredation change with crosslinkers concentration: ··· = G-0.5, -.-.- = G-1, — = G-2.

3 Thermal degredation change with crosslinkers concentration: ··· = G-0.5, -.-.- = G-1, — = G-2.

4 The penetration-temperature curves of IPNs: ○ = G-0.5, □ = G-1, ▵ = G-2.

4 The penetration-temperature curves of IPNs: ○ = G-0.5, □ = G-1, ▵ = G-2.

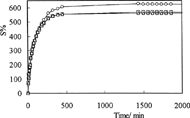
5 Swelling curves of C-P-A IPNs at pH 1.1: ○ = G-0.5, □ = G-1, ▵ = G-2.

5 Swelling curves of C-P-A IPNs at pH 1.1: ○ = G-0.5, □ = G-1, ▵ = G-2.

6 Swelling curves of C-P-A IPNs at pH 7.4: ○ = G-0.5, □ = G-1, ▵ = G-2.

6 Swelling curves of C-P-A IPNs at pH 7.4: ○ = G-0.5, □ = G-1, ▵ = G-2.

7 Swelling rate curves of C-P-A IPNs at pH 1.1: ○ = G-0.5, □ = G-1, ▵ = G-2.

7 Swelling rate curves of C-P-A IPNs at pH 1.1: ○ = G-0.5, □ = G-1, ▵ = G-2.

8 Swelling rate curves of C-P-A IPNs at pH 7.4: ○ = G-0.5, □ = G-1, ▵ = G-2.

8 Swelling rate curves of C-P-A IPNs at pH 7.4: ○ = G-0.5, □ = G-1, ▵ = G-2.

Swelling and diffusion parameters of IPNs at pH 1.1

9 Plots of lnF versus lnt of C-P-A IPNs at pH 1.1: ○ = G-0.5, □ = G-1, ▵ = G-2.

9 Plots of lnF versus lnt of C-P-A IPNs at pH 1.1: ○ = G-0.5, □ = G-1, ▵ = G-2.

10 Plots of lnF versus lnt of C-P-A IPNs at pH 7.4: ○ = G-0.5, □ = G-1, ▵ = G-2.

10 Plots of lnF versus lnt of C-P-A IPNs at pH 7.4: ○ = G-0.5, □ = G-1, ▵ = G-2.

Swelling and diffusion parameters of IPNs at pH 7.4

11 In vitro amoxicillin release profiles from C-P-A IPNs at pH 1.1: ○ = G-0.5, □ = G-1, ▵ = G-2.

11 In vitro amoxicillin release profiles from C-P-A IPNs at pH 1.1: ○ = G-0.5, □ = G-1, ▵ = G-2.

12 In vitro amoxicillin release profiles from C-P-A IPNs at pH 7.4: ○ = G-0.5, □ = G-1, ▵ = G-2.

12 In vitro amoxicillin release profiles from C-P-A IPNs at pH 7.4: ○ = G-0.5, □ = G-1, ▵ = G-2.

Release kinetic parameters of IPNs in solutions with different pH

13 Release rate curves of C-P-A IPNs at pH 1.1: ○ = G-0.5, □ = G-1, ▵ = G-2.

13 Release rate curves of C-P-A IPNs at pH 1.1: ○ = G-0.5, □ = G-1, ▵ = G-2.

14 Release rate curves of C-P-A IPNs at pH 7.4: ○ = G-0.5, □ = G-1, ▵ = G-2.

14 Release rate curves of C-P-A IPNs at pH 7.4: ○ = G-0.5, □ = G-1, ▵ = G-2.

15 Plots of lnC versus lnt of C-P-A IPNs at pH 1.1: ○ = G-0.5, □ = G-1, ▵ = G-2.

15 Plots of lnC versus lnt of C-P-A IPNs at pH 1.1: ○ = G-0.5, □ = G-1, ▵ = G-2.

16 Plots of lnC vs. lnt of C-P-A IPNs at pH 7.4: ○ = G-0.5, □ = G-1, ▵ = G-2.

16 Plots of lnC vs. lnt of C-P-A IPNs at pH 7.4: ○ = G-0.5, □ = G-1, ▵ = G-2.

Release diffusion parameters of IPNs in solutions with different pH

Reprints and Corporate Permissions

Please note: Selecting permissions does not provide access to the full text of the article, please see our help page How do I view content?

To request a reprint or corporate permissions for this article, please click on the relevant link below:

Academic Permissions

Please note: Selecting permissions does not provide access to the full text of the article, please see our help page How do I view content?

Obtain permissions instantly via Rightslink by clicking on the button below:

If you are unable to obtain permissions via Rightslink, please complete and submit this Permissions form. For more information, please visit our Permissions help page.