Figures & data
FIG. 1 Route for the synthesis of chlorambucil-tempol.
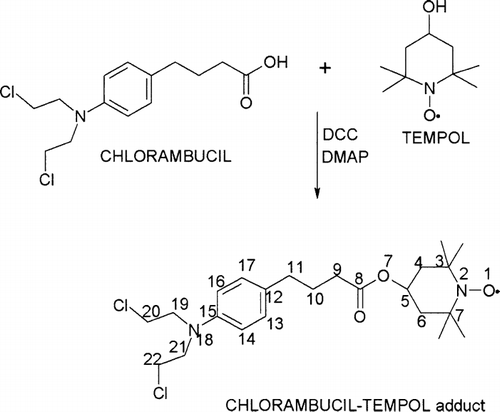
FIG. 2 EPR spectra of tempol (a) and CT (b) in methylene chloride solvents and (c) 0.5% CT in 10% 10KC8 hydrogel at 293.2 K.
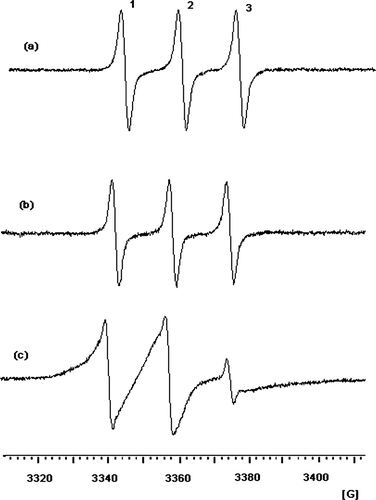
FIG. 3 1H NMR spectrum of the nitroxyl-reduced CT in CDCl3 solvent referenced with TMS to 0 ppm at 299.3 K.
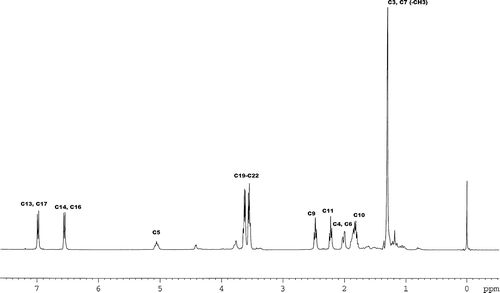
TABLE 1 Chemical shifts in ppm of the nitroxyl-reduced CT with multiplicities in parenthesis
FIG. 4 Maldi-TOF of the CT in 2,5-dihydroxybenzoic acid matrix.
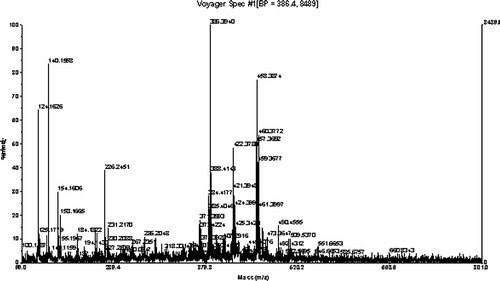
FIG. 5 1H NMR spectrum (a) and 19F NMR spectrum (b) of the 10KC8 hydrogel loaded with CT at 299.3 K.
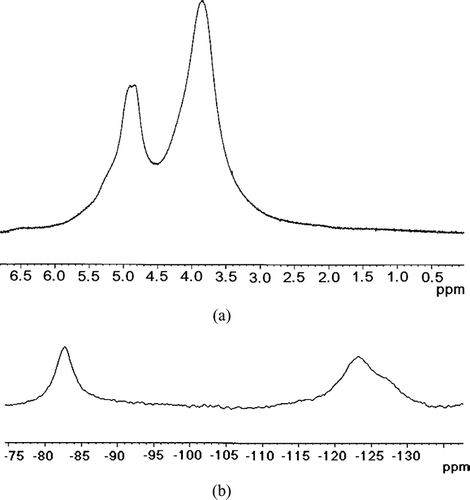
TABLE 2 Comparison of T1 relaxation times for 10KC8 hydrogel, tempol loaded 10KC8 hydrogel and CT loaded 10KC8 hydrogel