3,263
Views
53
CrossRef citations to date
0
Altmetric
Research Article

Caffeine-Loaded Niosomes: Characterization and in Vitro Release Studies

, &
Pages 447-452 | Received 02 Nov 2006, Accepted 20 Jan 2007, Published online: 10 Oct 2008

Figures & data

TABLE 1 Composition of caffeine loaded niosomes, mean volume diameter of vesicles, and caffeine encapsulation efficiency at different time intervals after preparation and storage at 4°C.

FIGURE 1 Optical micrographs (× 1000 magnification) of caffeine-containing niosomes prepared by film hydration method. Niosomes were composed of (a) Span 20/CHOL/CTAB, (b) Span 60/CHOL, and (c) Span 40/CHOL. Scale bar = 10 μ m.
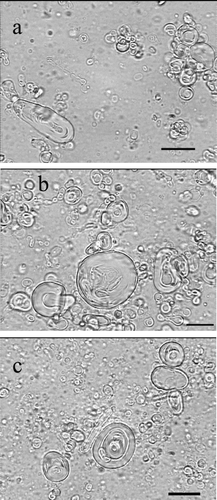
FIGURE 1 Optical micrographs (× 1000 magnification) of caffeine-containing niosomes prepared by film hydration method. Niosomes were composed of (a) Span 20/CHOL/CTAB, (b) Span 60/CHOL, and (c) Span 40/CHOL. Scale bar = 10 μ m.

FIGURE 2 The vesicle size distribution of caffeine-containing niosomes prepared by film hydration method. Niosomes were composed of span 60/CHOL (7:3 m.r.) or span 60/CHOL/CTAB (5:3:2 m.r.).
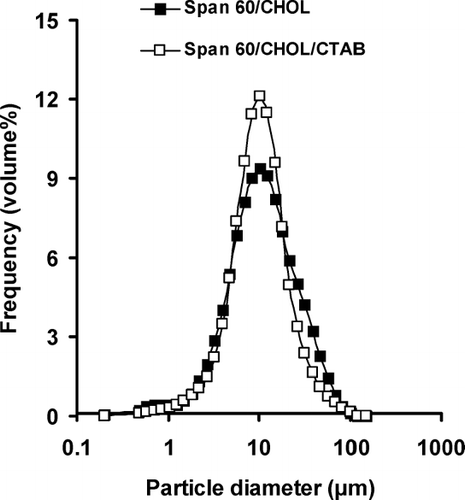
FIGURE 2 The vesicle size distribution of caffeine-containing niosomes prepared by film hydration method. Niosomes were composed of span 60/CHOL (7:3 m.r.) or span 60/CHOL/CTAB (5:3:2 m.r.).

FIGURE 3 The effect of surfactants HLB values on the mean volume diameter of neutral and positive niosomes.
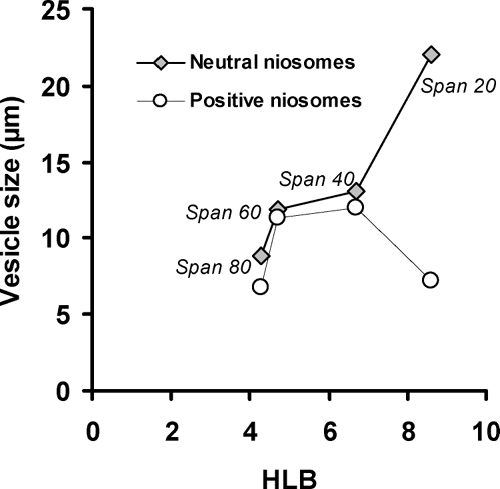
FIGURE 3 The effect of surfactants HLB values on the mean volume diameter of neutral and positive niosomes.

FIGURE 4 Permeation profiles of caffeine through cellulose acetate after application of drug-containing neutral or positively charged niosomal formulations and free drug solution using Franz diffusion cells. Each point represents the mean ± SD (n = 3).
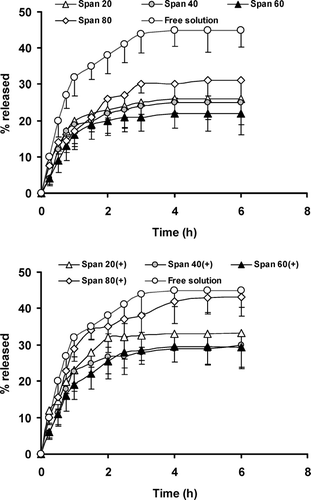
FIGURE 4 Permeation profiles of caffeine through cellulose acetate after application of drug-containing neutral or positively charged niosomal formulations and free drug solution using Franz diffusion cells. Each point represents the mean ± SD (n = 3).

TABLE 2 Diffusion exponent (n) of Peppas model, calculated release rate (K) constants, and regression coefficient (r2, in brackets) of caffeine release data from studied niosomes according to different kinetic models

Reprints and Corporate Permissions

Please note: Selecting permissions does not provide access to the full text of the article, please see our help page How do I view content?

To request a reprint or corporate permissions for this article, please click on the relevant link below:

Academic Permissions

Please note: Selecting permissions does not provide access to the full text of the article, please see our help page How do I view content?

Obtain permissions instantly via Rightslink by clicking on the button below:

If you are unable to obtain permissions via Rightslink, please complete and submit this Permissions form. For more information, please visit our Permissions help page.