Figures & data
FIG. 1 Size of LM-RFP particles. The particle size of the LM formulation was measured by a particle analyzer (ELS-8000, Otsuka Electronics Co., Tokyo, Japan). Each formulation was diluted by distilled water for measurement.
FIG. 2 In vitro uptake of RFP by alveolar macrophages. NR8383 cells (1 × 10⁶/mL) were incubated with 50 μL of [3H]RFP or [3H]LM-RFP (100 μg as RFP) at 4°C or 37°C for 1 hr or 4 hr. Then the amount of [3H]RFP incorporated was determined by counting the radioactivity. Values were expressed as the percentage (%) of cellular RFP amounts to applied total RFP. N = 4. Bars show the standard deviations.
![FIG. 2 In vitro uptake of RFP by alveolar macrophages. NR8383 cells (1 × 10⁶/mL) were incubated with 50 μL of [3H]RFP or [3H]LM-RFP (100 μg as RFP) at 4°C or 37°C for 1 hr or 4 hr. Then the amount of [3H]RFP incorporated was determined by counting the radioactivity. Values were expressed as the percentage (%) of cellular RFP amounts to applied total RFP. N = 4. Bars show the standard deviations.](/cms/asset/5ff661ff-7973-4408-a890-3f4e63f69cd4/idrd_a_295419_uf0002_b.gif)
FIG. 3 In vitro and in vivo uptake of LM by alveolar macrophages. NR8383 cells (1 × 10⁶/mL) were incubated with 50 μL of (A) AdipoRed solution or (B) LM-AdipoRed™ for 3 hr at 37°C. (C) Giemsa staining of NR8383. Under anesthesia, rats were given 200 μL of (D) AdipoRed solution or (E) LM-AdipoRed through intratracheal route. Bronchoalveolar cells were obtained at 10 min after dosing. (F) Giemsa staining of bronchoalveolar cells. Most cells were macrophages. Scale bar is 30 μm. Fluorescence intensity was determined by flow cytometry. As compared with cell alone (–), fluorescence intensity became higher with the increase cellular uptake of AdipoRed (grey) and LM- AdipoRed (red). Representative photographs show (A and D) AdipoRed-treated and (B and E) LM-AdipoRed-treated cells. AdipoRed is seen as the red-colored areas.
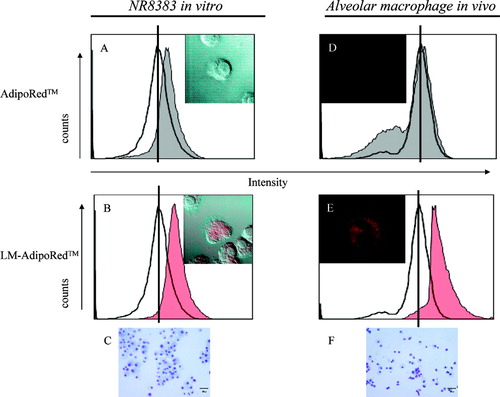
TABLE 1 Uptake of Rifampicin (RFP) by alveolar pulmonary macrophages in vivo
FIG. 4 Distribution of [3H]RFP following administration of [3H]RFP or [3H]LM-RFP to mice. Under anesthesia, normal male ICR mice were given 30 μL of [3H]RFP or [3H]LM-RFP via the intranasal route (in). At 30 min after dosing, the radioactivity of the blood and organs was determined. [3H]RFP also was given to mice via the oral route (po), while the LM formulation also was administered to mice intravenously (iv). Results are expressed as the percent (%) injected dose (ID) per g or mL. N = 3–6. Bars show the standard deviation. * p < 0.05; ** p < 0.01.
![FIG. 4 Distribution of [3H]RFP following administration of [3H]RFP or [3H]LM-RFP to mice. Under anesthesia, normal male ICR mice were given 30 μL of [3H]RFP or [3H]LM-RFP via the intranasal route (in). At 30 min after dosing, the radioactivity of the blood and organs was determined. [3H]RFP also was given to mice via the oral route (po), while the LM formulation also was administered to mice intravenously (iv). Results are expressed as the percent (%) injected dose (ID) per g or mL. N = 3–6. Bars show the standard deviation. * p < 0.05; ** p < 0.01.](/cms/asset/30f1760d-3c0a-45f5-8bda-83593b615212/idrd_a_295419_uf0004_b.gif)
TABLE 2 Distribution of [3H]RFP following intranasal administration of the formulations to mice (%/g or mL)