Figures & data
Table 1. Compositions of the formulations.
Table 2. Polymer content, viscosity, and drug release parameters (by using cellulose membrane at the end of a 4-h period) of the formulations.
Table 3. The kinetic parameters of the release of MTC from the formulations by using cellulose membrane.
Figure 1. Comparison of ex vivo drug release from different dosage forms (S3 solution, G2 gel, P2 and EP2 powder) prepared with NaCMC by using nasal mucosa (S3-G2, S3-P2, G2-P2, P2-EP2: p < 0.05).
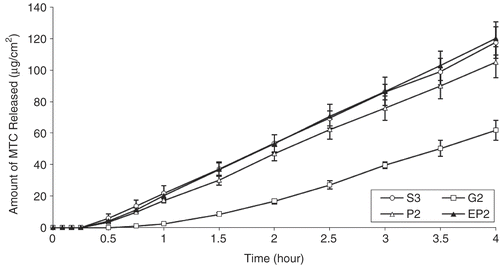
Table 4. Drug release parameters of the formulations in ex vivo experiments by using nasal mucosa and the mean scoringa values from the light microscopy study subsequent to the transport study of formulations.
Figure 2. Comparison of in vitro and ex vivo release of MTC from different dosage forms (S3 solution, G2 gel, P2 and EP2 powder) by using cellulose membrane and nasal mucosa at the end of 4 h period.
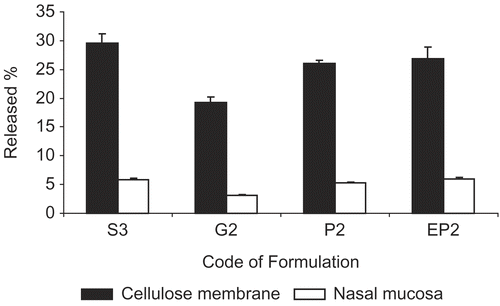
Figure 3. Images from the histological evaluation of nasal mucosa; control (a), solution (b; S3), gel (c; G2), powder (d; P2) and powder + HPβCD (e; EP2).
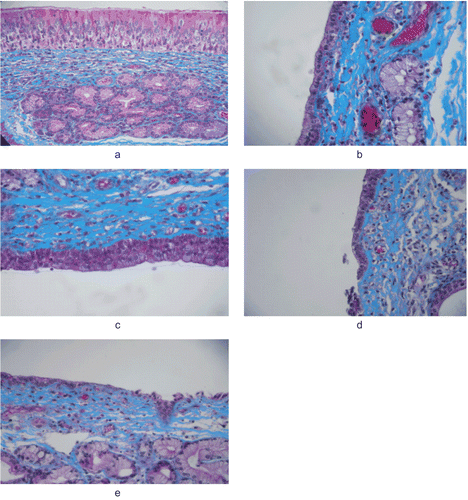
Figure 4. Mean sera concentration-time profiles in sheep after oral, IV, and intranasal administations of different formulations at a dose of 0.4 mg/kg applied to five sheep (G2-S3, P2, EP2: p < 0.05; P2-EP2: p < 0.05).
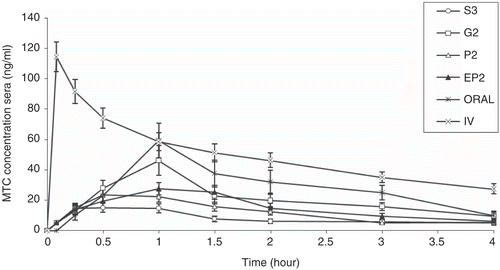
Table 5. Pharmacokinetic parameters after intravenous, oral and nasal administration of MTC in sheep (n = 5).