1,623
Views
28
CrossRef citations to date
0
Altmetric
Research Article

Liposome composition is important for retention of liposomal rhodamine in P-glycoprotein-overexpressing cancer cells

, , , &
Pages 261-267 | Received 25 Feb 2009, Accepted 27 Mar 2009, Published online: 30 Apr 2009

Figures & data

Figure 1. Expression of p-glycoprotein in MCF-7/WT and MCF-7/Pgp cells. (A) Expression of Pgp, MRP1 and BCRP mRNA in MCF-7 cells was determined by semi-quantitative RT-PCR, with GAPDH mRNA serving as a loading control. (B) Immunoblot analysis of Pgp protein expression in cells. Immunoblotting with an antibody to β-actin was used to ensure equal loading of proteins in each lane.
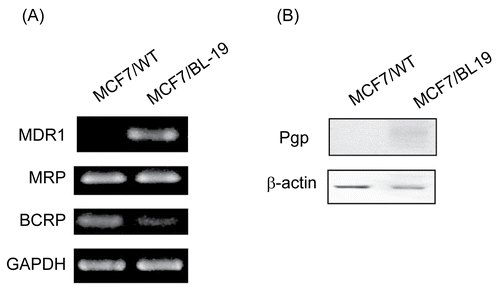
Figure 1.  Expression of p-glycoprotein in MCF-7/WT and MCF-7/Pgp cells. (A) Expression of Pgp, MRP1 and BCRP mRNA in MCF-7 cells was determined by semi-quantitative RT-PCR, with GAPDH mRNA serving as a loading control. (B) Immunoblot analysis of Pgp protein expression in cells. Immunoblotting with an antibody to β-actin was used to ensure equal loading of proteins in each lane.

Figure 2. Rhodamine uptake and retention in MCF-7/WT and MCF-7/Pgp cells. (A) Time course of rhodamine uptake into MCF-7/WT cells. Cells were exposed to 90 ng/ml rhodamine for the time period indicated. (B) Dose-dependent uptake of rhodamine into MCF-7/WT cells. Cells were exposed to indicating concentrations of rhodamine for 4 h. (C) Rhodamine retention in MCF-7/WT and MCF-7/Pgp cells. Cells pre-incubated with 90 ng/ml rhodamine for 4 h were washed three times with PBS and further incubated in medium free of rhodamine for the indicated times. Cellular extracts were obtained and subjected to spectrofluorimetric analysis as described in the text. Data are presented as means ± SD (n = 3) and analyzed by Student’s t-test. Statistical comparisons between MCF-7/WT and MCF-7/Pgp cells are presented: * p < 0.05, ** p < 0.005.
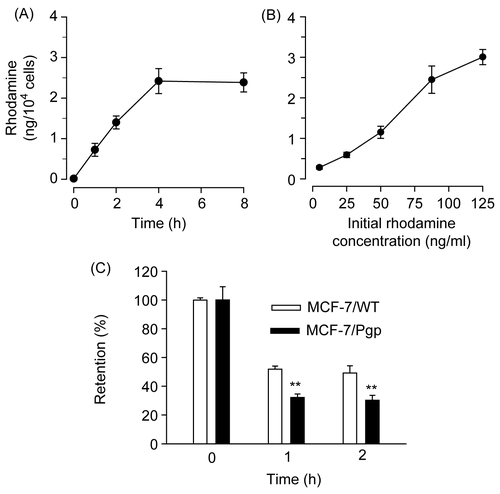
Figure 2.  Rhodamine uptake and retention in MCF-7/WT and MCF-7/Pgp cells. (A) Time course of rhodamine uptake into MCF-7/WT cells. Cells were exposed to 90 ng/ml rhodamine for the time period indicated. (B) Dose-dependent uptake of rhodamine into MCF-7/WT cells. Cells were exposed to indicating concentrations of rhodamine for 4 h. (C) Rhodamine retention in MCF-7/WT and MCF-7/Pgp cells. Cells pre-incubated with 90 ng/ml rhodamine for 4 h were washed three times with PBS and further incubated in medium free of rhodamine for the indicated times. Cellular extracts were obtained and subjected to spectrofluorimetric analysis as described in the text. Data are presented as means ± SD (n = 3) and analyzed by Student’s t-test. Statistical comparisons between MCF-7/WT and MCF-7/Pgp cells are presented: * p < 0.05, ** p < 0.005.
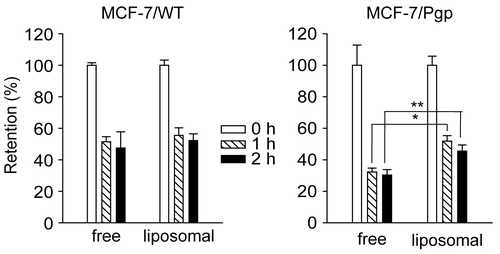
Figure 3. Retention of rhodamine in MCF-7/WT and MCF-7/Pgp cells following incubation with rhodamine in free forms or liposome-loaded forms. Rhodamine was loaded in liposomes prepared with 7:3 molar ratios of DMPC and CHOL. Cells pre-incubated with 90 ng/ml of free or liposomal rhodamine for 4 h were washed three times with PBS and further incubated in medium free of rhodamine for the indicated times. Cellular extracts were obtained and subjected to spectrofluorimetric analysis as described in the text. Data are presented as means ± SD (n = 3) and analyzed by Student’s t-test. Statistical comparisons between MCF-7/WT and MCF-7/Pgp cells are presented: * p < 0.05, ** p < 0.005.

Figure 3.  Retention of rhodamine in MCF-7/WT and MCF-7/Pgp cells following incubation with rhodamine in free forms or liposome-loaded forms. Rhodamine was loaded in liposomes prepared with 7:3 molar ratios of DMPC and CHOL. Cells pre-incubated with 90 ng/ml of free or liposomal rhodamine for 4 h were washed three times with PBS and further incubated in medium free of rhodamine for the indicated times. Cellular extracts were obtained and subjected to spectrofluorimetric analysis as described in the text. Data are presented as means ± SD (n = 3) and analyzed by Student’s t-test. Statistical comparisons between MCF-7/WT and MCF-7/Pgp cells are presented: * p < 0.05, ** p < 0.005.

Figure 4. Effect of liposomal composition on the retention of rhodamine loaded in liposomes. (A) Rhodamine was loaded in liposomes prepared with 10:0, 8:2, 6:4, or 4.5:5.5 molar ratios of DMPC:CHOL. (B) Liposomes were prepared with 14 μmole of lipid mixtures composed of DMPC:CHOL (6:4), DMPC:CHOL:DCP (6:4:1), DMPC:CHOL:DMPG (6:4:1), DMPC:CHOL:SA (6:4:1), or DMPC:CHOL:DOTAP (6:4:1). (C) liposomes were prepared with 14 μmole of lipid mixtures composed of DMPC:CHOL (6:4), DMPC:CHOL:DPPE-PEG350 (6:4:1), or DMPC:CHOL:DPPE-PEG5000 (6:4:1). Cells pre-incubated with 90 ng/ml of liposomal rhodamine for 4 h were washed, and further incubated in medium free of rhodamine for the indicated times. Cellular extracts were obtained and subjected to spectrofluorimetric analysis as described in the text. Data are presented as means ± SD (n = 3).
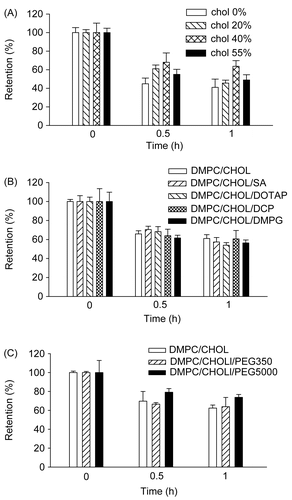
Figure 4.  Effect of liposomal composition on the retention of rhodamine loaded in liposomes. (A) Rhodamine was loaded in liposomes prepared with 10:0, 8:2, 6:4, or 4.5:5.5 molar ratios of DMPC:CHOL. (B) Liposomes were prepared with 14 μmole of lipid mixtures composed of DMPC:CHOL (6:4), DMPC:CHOL:DCP (6:4:1), DMPC:CHOL:DMPG (6:4:1), DMPC:CHOL:SA (6:4:1), or DMPC:CHOL:DOTAP (6:4:1). (C) liposomes were prepared with 14 μmole of lipid mixtures composed of DMPC:CHOL (6:4), DMPC:CHOL:DPPE-PEG350 (6:4:1), or DMPC:CHOL:DPPE-PEG5000 (6:4:1). Cells pre-incubated with 90 ng/ml of liposomal rhodamine for 4 h were washed, and further incubated in medium free of rhodamine for the indicated times. Cellular extracts were obtained and subjected to spectrofluorimetric analysis as described in the text. Data are presented as means ± SD (n = 3).

Figure 5. Mean particle size and rhodamine release characteristics of liposomes. (A) Release profile of rhodamine from liposomes in culture media containing 10% FCS at 37°C. (B) Mean particle size (χ) and polydispersity index (PI) (•) of liposomes. Rhodamine-loaded liposomes were prepared with 14 μmole of lipid mixtures composed of DMPC alone, DMPC:CHOL (6:4), DMPC:CHOL:DPPE-PEG350 (6:4:1), or DMPC:CHOL:DPPE-PEG5000 (6:4:1). Data are presented as means ± SD (n = 3).
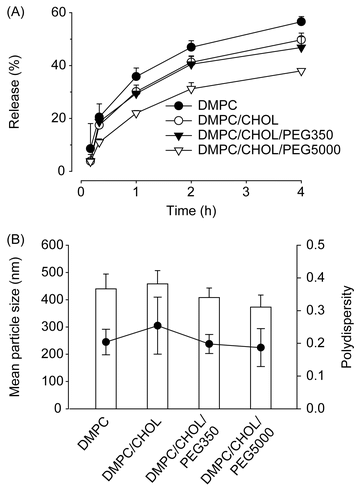
Figure 5.  Mean particle size and rhodamine release characteristics of liposomes. (A) Release profile of rhodamine from liposomes in culture media containing 10% FCS at 37°C. (B) Mean particle size (χ) and polydispersity index (PI) (•) of liposomes. Rhodamine-loaded liposomes were prepared with 14 μmole of lipid mixtures composed of DMPC alone, DMPC:CHOL (6:4), DMPC:CHOL:DPPE-PEG350 (6:4:1), or DMPC:CHOL:DPPE-PEG5000 (6:4:1). Data are presented as means ± SD (n = 3).

Reprints and Corporate Permissions

Please note: Selecting permissions does not provide access to the full text of the article, please see our help page How do I view content?

To request a reprint or corporate permissions for this article, please click on the relevant link below:

Academic Permissions

Please note: Selecting permissions does not provide access to the full text of the article, please see our help page How do I view content?

Obtain permissions instantly via Rightslink by clicking on the button below:

If you are unable to obtain permissions via Rightslink, please complete and submit this Permissions form. For more information, please visit our Permissions help page.